
(a)
Interpretation:
The engineering stress-strain curve should be plotted and the 0.2 % offset yield strength should be calculated for the given data of a ductile cast iron.
Concept Introduction:
The maximum amount of elastic deformation which is bearable by any material is defined as yield strength.
Answer to Problem 6.41P
The yield strength for 0.2% offset is 274 MPa for given sample of a ductile cast iron.
Explanation of Solution
The tabular data providing details about the load and length difference for given sample is as follows:
| Load(lb) | |
| 0 | 0.00000 |
| 25,000 | 0.0185 |
| 50,000 | 0.0370 |
| 75,000 | 0.0555 |
| 90,000 | 0.20 |
| 105,000 | 0.60 |
| 120,000 | 1.56 |
| 131,000 | 4.00 (maximum load) |
| 125,000 | 7.52 (fracture) |
Now, let us first calculate area of a ductile iron sample by using the following formula:
In which
So, the area of the iron sample can be calculated as follows:
Now, determine the stress for the given specimen as follows:
For determining the strain of the given sample,
With the use of given spread sheet and applied loads, The tabulate form of the engineering stress and strain is as follows:
| Load (P)N | Area (A) | Stress ( | Change in length ( | Strain ( |
| 0 | 314.16 | 0 | 0 | 0 |
| 25,000 | 314.16 | 79.58 | 0.0185 | 0.000465 |
| 50,000 | 314.16 | 159.15 | 0.0370 | 0.000925 |
| 75,000 | 314.16 | 238.73 | 0.0555 | 0.0013875 |
| 90,000 | 314.16 | 286.48 | 0.20 | 0.005 |
| 105,000 | 314.16 | 334.22 | 0.60 | 0.015 |
| 120,000 | 314.16 | 381.97 | 1.56 | 0.039 |
| 131,000 (max. load) | 314.16 | 416.98 | 4.00 | 0.1 |
| 125,000 (fracture) | 314.16 | 397.87 | 7.52 | 0.188 |
Now, the plot of the stress-strain from the above tabular data is as follows:

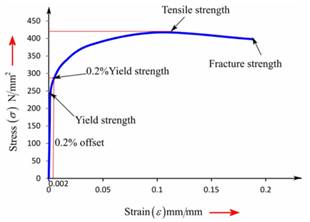
The above graph can provide the value of yield strength for 0.2% offset at around 274 MPa after drawing a parallel line to linear to stress-strain curve.
Therefore, the ductile cast iron contains the yield strength for 0.2% offset as 274 MPa.
(b)
Interpretation:
With the help of plotted engineering stress-strain curve, the tensile strength should be calculated for the given data of a ductile cast iron.
Concept Introduction:
Tensile strength can be defined as the measurement of maximum deformation which can be bearable by any material without undergoing necking condition.
Answer to Problem 6.41P
The tensile strength is 417 MPa for given sample of a ductile cast iron.
Explanation of Solution
With the use of given spread sheet and applied loads, engineering stress and strain can be tabulated as follows:
| Load (P)N | Area (A) | Stress ( | Change in length ( | Strain ( |
| 0 | 314.16 | 0 | 0 | 0 |
| 25,000 | 314.16 | 79.58 | 0.0185 | 0.000465 |
| 50,000 | 314.16 | 159.15 | 0.0370 | 0.000925 |
| 75,000 | 314.16 | 238.73 | 0.0555 | 0.0013875 |
| 90,000 | 314.16 | 286.48 | 0.20 | 0.005 |
| 105,000 | 314.16 | 334.22 | 0.60 | 0.015 |
| 120,000 | 314.16 | 381.97 | 1.56 | 0.039 |
| 131,000 (max. load) | 314.16 | 416.98 | 4.00 | 0.1 |
| 125,000 (fracture) | 314.16 | 397.87 | 7.52 | 0.188 |
Now, the stress-strain curve can be plotted from the above gathered tabular data as follows:

The above graph can provide the value of tensile strength as 417 MPa.
Therefore, the tensile strength for given sample of a ductile cast iron can be considered as417 MPa.
(c)
Interpretation:
With the help of plotted engineering stress-strain curve, the value of modulus of elasticity should be calculated for the given data of a ductile cast iron.
Concept Introduction:
Modulus of elasticity is also known as coefficient of elasticity or elastic modulus and can be defined as the ratio of the stress in the given object body to the corresponding strain.
Answer to Problem 6.41P
The value of modulus of elasticity is 172.057 GPa for a ductile cast iron..
Explanation of Solution
With the use of given spread sheet and applied loads, one can tabulate the engineering stress and strain as follows:
| Load (P)N | Area (A) | Stress ( | Change in length ( | Strain ( |
| 0 | 314.16 | 0 | 0 | 0 |
| 25,000 | 314.16 | 79.58 | 0.0185 | 0.000465 |
| 50,000 | 314.16 | 159.15 | 0.0370 | 0.000925 |
| 75,000 | 314.16 | 238.73 | 0.0555 | 0.0013875 |
| 90,000 | 314.16 | 286.48 | 0.20 | 0.005 |
| 105,000 | 314.16 | 334.22 | 0.60 | 0.015 |
| 120,000 | 314.16 | 381.97 | 1.56 | 0.039 |
| 131,000 (max. load) | 314.16 | 416.98 | 4.00 | 0.1 |
| 125,000 (fracture) | 314.16 | 397.87 | 7.52 | 0.188 |
Now, one can plot the stress-strain curve from the above gathered tabular data as follows:

One can use the formula of Hook's law as below for calculating modulus of elasticity.
Therefore, the value of modulus of elasticity for a ductile cast iron can be described as 172.057GPa.
(d)
Interpretation:
With the help of plotted engineering stress-strain curve, the value of % elongation should be calculated for the given data of a ductile cast iron.
Concept Introduction:
Elongation is defined as term used to determine the change in gauge length of any material when it is on static tension test.
Answer to Problem 6.41P
The value of % elongation is 18.55% for a ductile cast iron.
Explanation of Solution
With the use of given spread sheet and applied loads, one can tabulate the engineering stress and strain as follows:
| Load (P)N | Area (A) | Stress ( | Change in length ( | Strain ( |
| 0 | 314.16 | 0 | 0 | 0 |
| 25,000 | 314.16 | 79.58 | 0.0185 | 0.000465 |
| 50,000 | 314.16 | 159.15 | 0.0370 | 0.000925 |
| 75,000 | 314.16 | 238.73 | 0.0555 | 0.0013875 |
| 90,000 | 314.16 | 286.48 | 0.20 | 0.005 |
| 105,000 | 314.16 | 334.22 | 0.60 | 0.015 |
| 120,000 | 314.16 | 381.97 | 1.56 | 0.039 |
| 131,000 (max. load) | 314.16 | 416.98 | 4.00 | 0.1 |
| 125,000 (fracture) | 314.16 | 397.87 | 7.52 | 0.188 |
Now, one can plot the stress-strain curve from the above gathered tabular data as follows:

One can use the below formula for determining the value of % elongation.
Therefore, the ductile cast iron has 18.55% elongation value.
(e)
Interpretation:
With the help of plotted engineering stress-strain curve, the value of % reduction in area should be calculated for the given data of a ductile cast iron.
Concept Introduction:
Reduction of area of any material is directly related to the reduction in cross-section area of the tensile test piece after fracture.
Answer to Problem 6.41P
The value of % reduction in area is 15.82 % for given sample of a ductile cast iron.
Explanation of Solution
With the use of given spread sheet and applied loads, one can tabulate the engineering stress and strain as follows:
| Load (P)N | Area (A) | Stress ( | Change in length ( | Strain ( |
| 0 | 314.16 | 0 | 0 | 0 |
| 25,000 | 314.16 | 79.58 | 0.0185 | 0.000465 |
| 50,000 | 314.16 | 159.15 | 0.0370 | 0.000925 |
| 75,000 | 314.16 | 238.73 | 0.0555 | 0.0013875 |
| 90,000 | 314.16 | 286.48 | 0.20 | 0.005 |
| 105,000 | 314.16 | 334.22 | 0.60 | 0.015 |
| 120,000 | 314.16 | 381.97 | 1.56 | 0.039 |
| 131,000 (max. load) | 314.16 | 416.98 | 4.00 | 0.1 |
| 125,000 (fracture) | 314.16 | 397.87 | 7.52 | 0.188 |
Now, one can plot the stress-strain curve from the above gathered tabular data as follows:

One can use the below formula for determining the value of % reduction in area.
Therefore, the ductile cast iron has 15.82% reduction in area.
(f)
Interpretation:
With the help of plotted engineering stress-strain curve, the engineering stress should be determined at fracture for the given data of a ductile cast iron.
Concept Introduction:
Engineering stress is a term explained as a force or applied load on the given object's cross-sectional area and it is also known as nominal stress.
Answer to Problem 6.41P
The engineering stress is 397.9 MPa for given sample of a ductile cast iron.
Explanation of Solution
With the use of given spread sheet and applied loads, one can tabulate the engineering stress and strain as follows:
| Load (P)N | Area (A) | Stress ( | Change in length ( | Strain ( |
| 0 | 314.16 | 0 | 0 | 0 |
| 25,000 | 314.16 | 79.58 | 0.0185 | 0.000465 |
| 50,000 | 314.16 | 159.15 | 0.0370 | 0.000925 |
| 75,000 | 314.16 | 238.73 | 0.0555 | 0.0013875 |
| 90,000 | 314.16 | 286.48 | 0.20 | 0.005 |
| 105,000 | 314.16 | 334.22 | 0.60 | 0.015 |
| 120,000 | 314.16 | 381.97 | 1.56 | 0.039 |
| 131,000 (max. load) | 314.16 | 416.98 | 4.00 | 0.1 |
| 125,000 (fracture) | 314.16 | 397.87 | 7.52 | 0.188 |
Now, one can plot the stress-strain curve from the above gathered tabular data as follows:

From the graph, one can determine the value of engineering stress at fracture as 397.9 MPa.
Therefore, the engineering stress can be considered as 397.9 MPa for given sample of a ductile cast iron.
(g)
Interpretation:
With the help of plotted engineering stress-strain curve, the true stress at necking should be determined at fracture for the given data of a ductile cast iron.
Concept Introduction:
True stress can be defined as the applied force or load that is divided by the cross-sectional area of specimen or object. It can be also defined as the required amount of force that tends to deformation of specimen.
Answer to Problem 6.41P
The true stress is 1472.69 MPa for given ductile cast iron at necking.
Explanation of Solution
With the use of given spread sheet and applied loads, one can tabulate the engineering stress and strain as follows:
| Load (P)N | Area (A) | Stress ( | Change in length ( | Strain ( |
| 0 | 314.16 | 0 | 0 | 0 |
| 25,000 | 314.16 | 79.58 | 0.0185 | 0.000465 |
| 50,000 | 314.16 | 159.15 | 0.0370 | 0.000925 |
| 75,000 | 314.16 | 238.73 | 0.0555 | 0.0013875 |
| 90,000 | 314.16 | 286.48 | 0.20 | 0.005 |
| 105,000 | 314.16 | 334.22 | 0.60 | 0.015 |
| 120,000 | 314.16 | 381.97 | 1.56 | 0.039 |
| 131,000 (max. load) | 314.16 | 416.98 | 4.00 | 0.1 |
| 125,000 (fracture) | 314.16 | 397.87 | 7.52 | 0.188 |
Now, one can plot the stress-strain curve from the above gathered tabular data as follows:

The formula for determining the strain of the given sample is as follows:
For calculating the true stress at necking, the formula used is as follows:
Therefore, the ductile cast iron has 1472.69 MP as a value of true stress at point of necking.
(h)
Interpretation:
With the help of plotted engineering stress-strain curve, the value of modulus of resilience should be determined for the given data of a ductile cast iron.
Concept Introduction:
The amount of energy required to get absorbed by the material to return back to its original state is defined as resilience.
Modulus of resilience can be defined as the energy required by the material to return from its stress condition from zero to the yield stress limit.
Answer to Problem 6.41P
The value of modulus of resilience is 0.17 MPa of given sample of ductile cast iron.
Explanation of Solution
With the use of given spread sheet and applied loads, one can tabulate the engineering stress and strain as below:
| Load (P)N | Area (A) | Stress ( | Change in length ( | Strain ( |
| 0 | 314.16 | 0 | 0 | 0 |
| 25,000 | 314.16 | 79.58 | 0.0185 | 0.000465 |
| 50,000 | 314.16 | 159.15 | 0.0370 | 0.000925 |
| 75,000 | 314.16 | 238.73 | 0.0555 | 0.0013875 |
| 90,000 | 314.16 | 286.48 | 0.20 | 0.005 |
| 105,000 | 314.16 | 334.22 | 0.60 | 0.015 |
| 120,000 | 314.16 | 381.97 | 1.56 | 0.039 |
| 131,000 (max. load) | 314.16 | 416.98 | 4.00 | 0.1 |
| 125,000 (fracture) | 314.16 | 397.87 | 7.52 | 0.188 |
Now, we can plot the stress-strain curve from the above gathered tabular data as below:
Therefore, the value of modulus of resilience can be considered as 0.17 MPa for the given sample of ductile cast iron.
Want to see more full solutions like this?
Chapter 6 Solutions
Essentials Of Materials Science And Engineering, Si Edition

- It is the middle of a winter snowstorm. Sally and Jin take shelter under an overhang. The loading of the snow on top of the overhang is shown in the figure below. The overhang is attached to the wall at points A and B with pin supports. Another pin is at C. Determine the reactions of the pin supports at A and B. Express them in Cartesian vector form.arrow_forwardPlease answer all questions 1. Calculate the magnitude (in RMS) of the current through R1 2. Calculate the magnitude (in RMS) of the current through R2. Simulation 1. Construct the circuit in Figure 2 in the Circuit JS simulator. Note that transformers in Circuit JS may be unstable. It is suggested to draw them by clicking from the bottom left corner to the top right corner and refresh your simulation before taking a measurement. 2. Perform a simulation, displaying the voltage across the voltage source, the current through R1, and the current through R2 in a “stacked” scope. Display the RMS average for each trace. Include a screenshot. Analysis 1. Compare the simulation results for the currents through R1 and R2. What is the percentage difference between the calculated and simulated value for each? Comment on why there may be a discrepancy.arrow_forwardPlease answer all You and your crew have made it through the night and the day has brought more warmth. After searching the industrial site, you find an abundant amount of fuel to run the generators to keep you warm. You also find a memory card labelled “cure”, but your cell phone battery is dead. First things first, you will need to stay safe as the zombies continue to hunt you in your current location. The industrial site is surrounded by a metal chain-link fence. You decide you will electrify the fence to keep the zombies from scaling it. But the output voltage from the generators is not high enough to really deter them. You would like to apply around 10 kV to the fence (AC or DC, at that voltage it doesn’t really matter). You find a transformer that you can use but it only has a turn ratio of 10. You find some diodes and capacitors and construct the circuit shown in Figure 3 with the intention of hooking Vout to the fence. 1. Perform a circuit JS simulation, displaying…arrow_forward
- 2. A three-phase transformer connection Yy, 2000 kVA, 20000/6000 V has the relative short-circuit voltages Ecc = 7% and ERcc = 1.7%.It is known that when empty this transformer consumes a power Po = 12.24 kW. Calculate:a. Parameters Zcc, Rcc, Xcc, referring to the primary and EXcc.b. If the transformer is connected at rated voltage and feeds a load of 1800 kVA, fp = 0.8, calculate the line voltage at the secondary.c. The maximum apparent power, and the maximum efficiency fp = 0.8 inductive. Perform the exercise by the collaborators and without using artificial intelligence pleasearrow_forwardA nozzle is attached to a fire hose by a bolted flange as shown below. What is the force tending to tear apart that flange when the valve in the nozzle is closed?arrow_forward1. A three-phase transformer with Yd connection, 300 kVA, 12000/220 V, has been short-circuit tested on the high voltage side giving the following results: 750 V, 14.434 A, 10838 W.When the transformer is connected to nominal voltage without load it consumes 5400W. Calculate:to. Relative voltages of short circuit high voltage side: εcc, εRcc and εXcc.b. The voltage in the secondary when the transformer is connected to nominal voltage and feeds a load of 200 kW fp = 0.8 in delay.c. Apparent power of maximum efficiency and maximum efficiency with fp = 0.95 inductive. Please solve for one of the collaborators and without using artificial intelligencearrow_forward
- Find value of load resistance RL that can be connected to terminals a-b for maximum power transfer. Also calculate the maximum power that can be delivered to load RL.arrow_forwardI need help finding: -The axial deflection pipe in inches. -The lateral deflection of the beam in inches -The total deflection of the beam like structure in inches ?arrow_forwardA modulating signal f(t) is bandlimited to 5 kHz is sampled at a rate of 15000 samples/sec. The samples are quantized into 128 levels. Calculate the transmission bandwidth if the following modulation types are used for signal transmission: 4- ASK 5- 8-PSK 6- FSK with Af = 25 kHzarrow_forward
- A 2.0 m wide strip foundation carries a wall load of 350 kN/m in a clayey soil where y = 17 kN/m³, c' = 5.0 kN/m² and 23°. The foundation depth is 1.5 m. For o' = 23°: Nc = 18.05; N = 8.66; N = 8.20. Determine the factor of safety using the equation below. 1 qu = c' NcFcs Fed Fci +qNqFqs FqdFqi + ½ BN F√s 1 2 (Enter your answer to three significant figures.) s Fyd Fi FS =arrow_forwardDraw the Split-Phase Manchester code for the follow ng binary data: (1001010110)arrow_forward1.2 m BX B 70 kN.m y = 16 kN/m³ c' = 0 6'-30° Water table Ysat 19 kN/m³ c' 0 &' = 30° A square foundation is shown in the figure above. Use FS = 6, and determine the size of the foundation. Use the Prakash and Saran theory (see equation and figures below). Suppose that F = 450 kN. Qu = BL BL[c′Nc(e)Fcs(e) + qNg(e)Fcs(e) + · 1 YBN(e) F 2 7(e) Fra(e)] (Enter your answer to two significant figures.) B: m Na(e) 60 40- 20- e/B=0 0.1 0.2 0.3 .0.4 0 0 10 20 30 40 Friction angle, ' (deg) Figure 1 Variation of Na(e) with o' Ny(e) 60 40 20 e/B=0 0.3 0.1 0.2 0.4 0 0 10 20 30 40 Friction angle, ' (deg) Figure 2 Variation of Nye) with o'arrow_forward
 MATLAB: An Introduction with ApplicationsEngineeringISBN:9781119256830Author:Amos GilatPublisher:John Wiley & Sons Inc
 Essentials Of Materials Science And EngineeringEngineeringISBN:9781337385497Author:WRIGHT, Wendelin J.Publisher:Cengage,
 Industrial Motor ControlEngineeringISBN:9781133691808Author:Stephen HermanPublisher:Cengage Learning
 Basics Of Engineering EconomyEngineeringISBN:9780073376356Author:Leland Blank, Anthony TarquinPublisher:MCGRAW-HILL HIGHER EDUCATION
 Structural Steel Design (6th Edition)EngineeringISBN:9780134589657Author:Jack C. McCormac, Stephen F. CsernakPublisher:PEARSON
 Fundamentals of Materials Science and Engineering...EngineeringISBN:9781119175483Author:William D. Callister Jr., David G. RethwischPublisher:WILEY