
(a)
Interpretation:
The diameter of the tensile bar is 0.505in. From a Cu-Ni alloy, this tensile bar is machined to 2.00 in gage length. The following data is observed.
| Load (lbs) | Gage length (in.) |
| 0 | 2.00000 |
| 1000 | 2.00045 |
| 2000 | 2.00091 |
| 3000 | 2.00136 |
| 4000 | 2.0020 |
| 6000 | 2.020 |
| 8000 | 2.052 |
| 10,000 | 2.112 |
| 11,000 | 2.80 (maximum load) |
| 9000 | 2.750 (fracture) |
Gage length and diameter was 2.75 in. and 0.365 in. respectively after the fracture.
For the observed data engineering stress and strain, the curve is to be plotted. From the plot, 0.2% offset yield strength needs to be determined.
Concept Introduction:
Following formula will be used for the calculation-
And
Answer to Problem 6.35P
Yield strength at 0.2 % offset is 28,000 psi.
Explanation of Solution
Diameter of bar = 0.505in
Therefore the area of cross-section of the bar is-
Where d is the diameter.
Put the value of d in (1):
Area = 0.200296 in2
Stress is given as force per unit area. The mathematical expression is given below-
Where s = stress
P= applied load
A = area
The strain is used to measure the amount of deformation caused by the applied load. The mathematical expression is given below-
Where,
So,
Where,
lf = final length
lo = initial length
Given value-
Length of bar or initial length = 2.00 in
Tabulate form for stress and strain data-
| Load (P) lb | Area in2 | stress psi | Gauge length ( lf) in. | Change in length ( | Strain
|
| 0 | 0.2002296 | 0 | 2.00000 | 0.00000 | 0 |
| 1,000 | 0.2002296 | 4992.61 | 2.00045 | 0.00045 | 0.000225 |
| 2,000 | 0.2002296 | 9985.22 | 2.00091 | 0.00091 | 0.000455 |
| 3,000 | 0.2002296 | 14977.83 | 2.00136 | 0.00136 | 0.00068 |
| 4,000 | 0.2002296 | 19970.44 | 2.0020 | 0.0020 | 0.0010 |
| 6,000 | 0.2002296 | 29955.66 | 2.020 | 0.020 | 0.01 |
| 8,000 | 0.2002296 | 39940.89 | 2.052 | 0.052 | 0.026 |
| 10,000 | 0.2002296 | 49926.11 | 2.112 | 0.112 | 0.056 |
| 11,000(max load) | 0.2002296 | 54918.72 | 2.280 | 0.280 | 0.140 |
| 9,000(fracture) | 0.2002296 | 44933.50 | 2.750 | 0.750 | 0.375 |
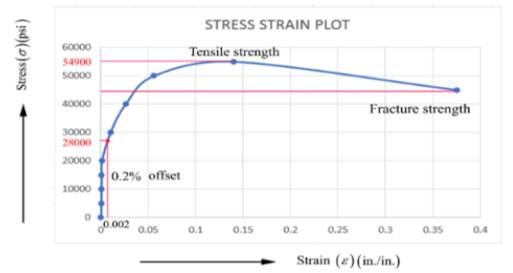
Stress-Strain curve based on above tabulated data-

From the above plot 0.2% offset yield strength is calculated as follows-
For calculation draw a line which is parallel to the stress and strain and meets the curve at 0.2 % offset. The value of stress at 0.2% offset is called as yield strength which is 28,000 psi.
Yield strength at 0.2 % offset = 28,000 psi.
(b)
Interpretation:
The tensile strength of the bar needs to be calculated from observed data and engineering stress and strain curve.
Concept Introduction:
Following formula will be used for the calculation-
And
Answer to Problem 6.35P
Tensile strength of the bar is 54900 psi from the stress-strain curve.
Explanation of Solution
Stress-Strain curve based on above tabulated data of section (a)-

Tensile strength of the material is the ability of the material to withstand the pulling force.
From the above plot, the obtained tensile strength value is 54900 psi.
Tensile strength = 54900 psi.
(c)
Interpretation:
The modulus of elasticity of bar needs to be calculated from observed data and engineering stress and strain curve.
Concept Introduction:
Following formula will be used for the calculation-
And
Answer to Problem 6.35P
Modulus of elasticity of bar is
Explanation of Solution
| Load (P) lb | Area in2 | stress psi | Gauge length ( lf) in. | Change in length ( | Strain
|
| 0 | 0.2002296 | 0 | 2.00000 | 0.00000 | 0 |
| 1,000 | 0.2002296 | 4992.61 | 2.00045 | 0.00045 | 0.000225 |
| 2,000 | 0.2002296 | 9985.22 | 2.00091 | 0.00091 | 0.000455 |
| 3,000 | 0.2002296 | 14977.83 | 2.00136 | 0.00136 | 0.00068 |
| 4,000 | 0.2002296 | 19970.44 | 2.0020 | 0.0020 | 0.0010 |
| 6,000 | 0.2002296 | 29955.66 | 2.020 | 0.020 | 0.01 |
| 8,000 | 0.2002296 | 39940.89 | 2.052 | 0.052 | 0.026 |
| 10,000 | 0.2002296 | 49926.11 | 2.112 | 0.112 | 0.056 |
| 11,000(max load) | 0.2002296 | 54918.72 | 2.280 | 0.280 | 0.140 |
| 9,000(fracture) | 0.2002296 | 44933.50 | 2.750 | 0.750 | 0.375 |
Stress-Strain curve based on tabulating data of section (a)-

Modulus of elasticity is obtained by the Hooke's law. It is the ratio of stress and strain which is given as-
From the table-
s = 9985.22 psi
e = 0.000455
Put the above values in (1)
Modulus of elasticity =
(d)
Interpretation:
The percentage of elongation of the bar needs to be calculated from observed data and engineering stress and strain curve.
Concept Introduction:
Following formula will be used for calculation-
And
Answer to Problem 6.35P
The percentage of elongation of the bar by observed data and engineering stress and strain curve is 37.5%.
Explanation of Solution
| Load (P) lb | Area in2 | stress psi | Gauge length ( lf) in. | Change in length ( | Strain
|
| 0 | 0.2002296 | 0 | 2.00000 | 0.00000 | 0 |
| 1,000 | 0.2002296 | 4992.61 | 2.00045 | 0.00045 | 0.000225 |
| 2,000 | 0.2002296 | 9985.22 | 2.00091 | 0.00091 | 0.000455 |
| 3,000 | 0.2002296 | 14977.83 | 2.00136 | 0.00136 | 0.00068 |
| 4,000 | 0.2002296 | 19970.44 | 2.0020 | 0.0020 | 0.0010 |
| 6,000 | 0.2002296 | 29955.66 | 2.020 | 0.020 | 0.01 |
| 8,000 | 0.2002296 | 39940.89 | 2.052 | 0.052 | 0.026 |
| 10,000 | 0.2002296 | 49926.11 | 2.112 | 0.112 | 0.056 |
| 11,000(max load) | 0.2002296 | 54918.72 | 2.280 | 0.280 | 0.140 |
| 9,000(fracture) | 0.2002296 | 44933.50 | 2.750 | 0.750 | 0.375 |
Stress-Strain curve on the basis of tabulating data of section (a)-

The percentage of elongation is the amount of deformation in the length of the bar.
It is calculated by using the following formula-
From table- lf ( final length) or fracture length = 2.75 in.
And given value −
lo( initial length) = 2 in.
Put the above values in Equ (1)
(e)
Interpretation:
The percentage of reduction in the area of the bar needs to be calculated from observed data and engineering stress and strain curve.
Concept Introduction:
Following formula will be used for the calculation-
And
Answer to Problem 6.35P
The percentage of reduction in the area of the bar by using observed data and engineering stress and strain curve is 47.76%.
Explanation of Solution
| Load (P) lb | Area in2 | stress psi | Gauge length ( lf) in. | Change in length ( | Strain |
| 0 | 0.2002296 | 0 | 2.00000 | 0.00000 | 0 |
| 1,000 | 0.2002296 | 4992.61 | 2.00045 | 0.00045 | 0.000225 |
| 2,000 | 0.2002296 | 9985.22 | 2.00091 | 0.00091 | 0.000455 |
| 3,000 | 0.2002296 | 14977.83 | 2.00136 | 0.00136 | 0.00068 |
| 4,000 | 0.2002296 | 19970.44 | 2.0020 | 0.0020 | 0.0010 |
| 6,000 | 0.2002296 | 29955.66 | 2.020 | 0.020 | 0.01 |
| 8,000 | 0.2002296 | 39940.89 | 2.052 | 0.052 | 0.026 |
| 10,000 | 0.2002296 | 49926.11 | 2.112 | 0.112 | 0.056 |
| 11,000(max load) | 0.2002296 | 54918.72 | 2.280 | 0.280 | 0.140 |
| 9,000(fracture) | 0.2002296 | 44933.50 | 2.750 | 0.750 | 0.375 |
Stress-Strain curve on the basis of tabulating data of section (a)-

% reduction in the area of the bar is determined by using the following formula which is given as-
Where,
Ao = initial area
Af = final area
Where d is the diameter of the bar.
From observed table-
df = 0.365 in.
Given value-
do = 0.505 in.
Put the above values in Equ (1) :
(f)
Interpretation:
The engineering stress at the fracture needs to be calculated from observed data and engineering stress and strain curve.
Concept Introduction:
Following formula will be used for the calculation-
And
Answer to Problem 6.35P
The engineering stress at the fracture is 44900 psi obtained from the plot.
Explanation of Solution
Stress-Strain curve on the basis of tabulating data of section (a)-
Engineering stress is defined as the force per unit area. The mathematical expression of engineering stress is given as-
From the plot of engineering stress and strain curve, the value of stress at the fracture is 44900 psi.
(g)
Interpretation:
The true stress at necking of bar is needs to be calculated from observed data and engineering stress and strain curve.
Concept Introduction:
Following formula will be used for the calculation-
The Relation between true stress and strain is-
Answer to Problem 6.35P
Stress at the necking of bar is 61783 psi.
Explanation of Solution
| Load (P) lb | Area in2 | stress psi | Gauge length ( lf) in. | Change in length ( | Strain |
| 0 | 0.2002296 | 0 | 2.00000 | 0.00000 | 0 |
| 1,000 | 0.2002296 | 4992.61 | 2.00045 | 0.00045 | 0.000225 |
| 2,000 | 0.2002296 | 9985.22 | 2.00091 | 0.00091 | 0.000455 |
| 3,000 | 0.2002296 | 14977.83 | 2.00136 | 0.00136 | 0.00068 |
| 4,000 | 0.2002296 | 19970.44 | 2.0020 | 0.0020 | 0.0010 |
| 6,000 | 0.2002296 | 29955.66 | 2.020 | 0.020 | 0.01 |
| 8,000 | 0.2002296 | 39940.89 | 2.052 | 0.052 | 0.026 |
| 10,000 | 0.2002296 | 49926.11 | 2.112 | 0.112 | 0.056 |
| 11,000(max load) | 0.2002296 | 54918.72 | 2.280 | 0.280 | 0.140 |
| 9,000(fracture) | 0.2002296 | 44933.50 | 2.750 | 0.750 | 0.375 |
Stress-Strain curve on the basis of tabulating data of section (a)-

Strain the maximum load is −
l = guage length
lo = initial length
From table-
l = 2.75 in.
Given value
lo = 2.00 in.
Put the above values in Equ(1)
True stress at the necking is calculated by −
P = 9000 lbs (from table)
do = 0.505 in.
Put the above values in Equ (2)
Stress at the necking =
(h)
Interpretation:
The modulus of resilience of bar needs to be calculated from observed data and engineering stress and strain curve.
Concept Introduction:
Following formula will be used for the calculation-
And
Answer to Problem 6.35P
The modulus of resilience of bar is 10 psi.
Explanation of Solution
| Load (P) lb | Area in2 | stress psi | Gauge length ( of) in. | Change in length ( | Strain |
| 0 | 0.2002296 | 0 | 2.00000 | 0.00000 | 0 |
| 1,000 | 0.2002296 | 4992.61 | 2.00045 | 0.00045 | 0.000225 |
| 2,000 | 0.2002296 | 9985.22 | 2.00091 | 0.00091 | 0.000455 |
| 3,000 | 0.2002296 | 14977.83 | 2.00136 | 0.00136 | 0.00068 |
| 4,000 | 0.2002296 | 19970.44 | 2.0020 | 0.0020 | 0.0010 |
| 6,000 | 0.2002296 | 29955.66 | 2.020 | 0.020 | 0.01 |
| 8,000 | 0.2002296 | 39940.89 | 2.052 | 0.052 | 0.026 |
| 10,000 | 0.2002296 | 49926.11 | 2.112 | 0.112 | 0.056 |
| 11,000(max load) | 0.2002296 | 54918.72 | 2.280 | 0.280 | 0.140 |
| 9,000(fracture) | 0.2002296 | 44933.50 | 2.750 | 0.750 | 0.375 |
Stress-Strain curve on the basis of tabulating data of section (a)-

The modulus of resilience can be explained as the amount of maximum energy absorbed by the material without any permanent deformation.
It is given as-
Where,
sy = yield stress
ey = yield strain
From the plot-
sy = 2000 psi
ey = 0.001
Put above values in Eq (1)
Want to see more full solutions like this?
Chapter 6 Solutions
Essentials Of Materials Science And Engineering, Si Edition

- Prelab Information Laboratory Preliminary Discussion Second-order RLC Circuit Analysis The second-order RLC circuit shown in figure 1 below represents all voltages and impedances as functions of the complex variable, s. Note, of course, that the impedances associated with R, RL, and Rs are constant independent of frequency, so the 's' notation is omitted. Again, one of the advantages of s-domain analysis is that we can apply all of the circuit analysis techniques learned for AC and DC circuits. ZI(s) Zc(s) Rs w RL ww + + VRS(S) VRL(S) VL(s) Vc(s) VR(S) R Vs(s) Figure 1: A second-order RLC circuit represented in the s-domain. To generate the s-domain expression for the output voltage, Vout(s) = VR(S), for the circuit shown in figure 1, we can apply voltage division in the s-domain as shown in equation 1 below. For equation 1 we define the following circuit parameters. RT=RS + RL + R where: R₁ = Total series resistance Rs Signal generator output resistance (fixed) Inductor internal…arrow_forward5.137 The BJT in the circuit of Fig. 5.137 has ẞ = 100. (a) Find the de collector current and the de voltage at the collector. (b) Replacing the transistor by its T model, draw the small-signal equivalent circuit of the amplifier. Analyze the resulting circuit to determine the voltage gain vo/vi. V ww 0.3 mA 300 ΚΩ = 250 Ω Va 30 ΚΩ www|| Fig. 5.137arrow_forwardsolve this, show all steps, no ai pz, please draw it outarrow_forward
- NO AI PLEASE WILL REJECTarrow_forwardUSE MATLAB ONLY Turbomachienery . GIven: vx = 185 m/s, flow angle = 60 degrees, R = 0.5, U = 150 m/s, b2 = -a3, a2 = -b3 Find: velocity triangle , a. magnitude of abs vel leaving rotor (m/s) b. flow absolute angles (a1, a2, a3) 3. flow rel angles (b2, b3) d. specific work done e. use code to draw vel. diagram Use this code for plot % plots Velocity Tri. in Ch4 function plotveltri(al1,al2,al3,b2,b3) S1L = [0 1]; V1x = [0 0]; V1s = [0 1*tand(al3)]; S2L = [2 3]; V2x = [0 0]; V2s = [0 1*tand(al2)]; W2s = [0 1*tand(b2)]; U2x = [3 3]; U2y = [1*tand(b2) 1*tand(al2)]; S3L = [4 5]; V3x = [0 0]; V3r = [0 1*tand(al3)]; W3r = [0 1*tand(b3)]; U3x = [5 5]; U3y = [1*tand(b3) 1*tand(al3)]; plot(S1L,V1x,'k',S1L,V1s,'r',... S2L,V2x,'k',S2L,V2s,'r',S2L,W2s,'b',U2x,U2y,'g',... S3L,V3x,'k',S3L,V3r,'r',S3L,W3r,'b',U3x,U3y,'g',...... 'LineWidth',2,'MarkerSize',10),... axis([-1 6 -4 4]), ... title('Velocity Triangle'), ... xlabel('x'),ylarrow_forwardI have gotten this far but cant figure out how to do the slopes!! i need help finding the weight.arrow_forward
- "?Can the expert help me solve only a bonus question using Arduino" The system must control 3 LEDs (Red, Green, and Blue) to operate in 4 different lighting modes: Mode 3: LEDs fade in and out smoothly (PWM control) in the order Red Green → Blue. Bonus Challenge (Potentiometer Control): The potentiometer (connected to pin A0) allows for dynamic control of the brightness during the fading mode (Mode 3). This allows the user to adjust how bright or dim the LEDs should fade in and out. This solution meets the project requirements, including the current limits, and provides interactive functionality with the push button and potentiometer.arrow_forwardResearch enterprise network services commonly performed by Linux servers. Choose 3 and describe their function, as well as why they are typically set up on Linux machines.arrow_forwardThe wall of a furnace has a thickness of 5 cm and thermal conductivity of 0.7 W/m-°C. The inside surface is heated by convection with a hot gas at 402°C and a heat transfer coefficient of 37 W/m²-°C. The outside surface has an emissivity of 0.8 and is exposed to air at 27°C with a heat transfer coefficient of 20 W/m²-ºC. Assume that the furnace is inside a large room with walls, floor and ceiling at 27°C. Show the thermal circuit and determine the heat flux through the furnace wall. h₁ T₁ k -L T. sur ho Earrow_forward
- Turbomachienery . GIven: vx = 185 m/s, flow angle = 60 degrees, R = 0.5, U = 150 m/s, b2 = -a3, a2 = -b3 Find: velocity triangle , a. magnitude of abs vel leaving rotor (m/s) b. flow absolute angles (a1, a2, a3) 3. flow rel angles (b2, b3) d. specific work done e. use code to draw vel. diagram Use this code for plot % plots Velocity Tri. in Ch4 function plotveltri(al1,al2,al3,b2,b3) S1L = [0 1]; V1x = [0 0]; V1s = [0 1*tand(al3)]; S2L = [2 3]; V2x = [0 0]; V2s = [0 1*tand(al2)]; W2s = [0 1*tand(b2)]; U2x = [3 3]; U2y = [1*tand(b2) 1*tand(al2)]; S3L = [4 5]; V3x = [0 0]; V3r = [0 1*tand(al3)]; W3r = [0 1*tand(b3)]; U3x = [5 5]; U3y = [1*tand(b3) 1*tand(al3)]; plot(S1L,V1x,'k',S1L,V1s,'r',... S2L,V2x,'k',S2L,V2s,'r',S2L,W2s,'b',U2x,U2y,'g',... S3L,V3x,'k',S3L,V3r,'r',S3L,W3r,'b',U3x,U3y,'g',...... 'LineWidth',2,'MarkerSize',10),... axis([-1 6 -4 4]), ... title('Velocity Triangle'), ... xlabel('x'),ylabel('y'), gridarrow_forwardTo save fuel during the heating season it is suggested that glass windows be covered at night with a 1.2 cm layer of polystyrene. Estimate the percent savings in energy and discuss the feasibility of this idea. Show the thermal circuit with and without the insulation panel. Consider a typical case of 0.2 cm thick window glass with inside and outside heat transfer coefficients of 6 and 32 W/m²-ºC. Lg←←Lp h T₁ T。 g kp insulation panelarrow_forwardSee the attached image for answeringarrow_forward
 MATLAB: An Introduction with ApplicationsEngineeringISBN:9781119256830Author:Amos GilatPublisher:John Wiley & Sons Inc
 Essentials Of Materials Science And EngineeringEngineeringISBN:9781337385497Author:WRIGHT, Wendelin J.Publisher:Cengage,
 Industrial Motor ControlEngineeringISBN:9781133691808Author:Stephen HermanPublisher:Cengage Learning
 Basics Of Engineering EconomyEngineeringISBN:9780073376356Author:Leland Blank, Anthony TarquinPublisher:MCGRAW-HILL HIGHER EDUCATION
 Structural Steel Design (6th Edition)EngineeringISBN:9780134589657Author:Jack C. McCormac, Stephen F. CsernakPublisher:PEARSON
 Fundamentals of Materials Science and Engineering...EngineeringISBN:9781119175483Author:William D. Callister Jr., David G. RethwischPublisher:WILEY