Concept explainers
Videos
(a)
The toughness of
(a)
Answer to Problem 6.18P
The toughness of
Explanation of Solution
Formula Used:
Write the expression for the first area.
Here,
Write the expression for the second area.
Here,
Write the expression for the third area.
Here,
Write the expression for the fourth area.
Here,
Write the expression for the fifth area.
Here,
Write the expression for the sixth area.
Here,
Write the expression for the seventh area.
Here,
Write the expression for the eighth area.
Here,
Write the expression for the ninth area.
Here,
Write the expression for the tenth area.
Here,
Write the expression for the eleventh area.
Here,
Write the expression for the toughness of specimen.
Write the expression for strain at yield point.
Calculation:
Refer Figure 6.22 “A true stress-strain diagram for
The stress strain diagram for
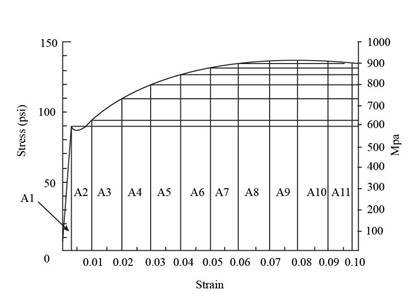
Figure (1)
Substitute
Substitute
Substitute
Substitute
Substitute
Substitute
Substitute
Substitute
Substitute
Substitute
Substitute
Substitute
Substitute
Conclusion:
Thus, the toughness of 1045 steel specimen is
(b)
The comparison of magnitude of
(b)
Explanation of Solution
Introduction:
The toughness of a specimen is defined as the strain energy per unit volume, required to fracture the specimen. Toughness is obtained when the stress-strain diagram to fracture is integrated. Toughness of a specimen plays a major role for its availability as an engineering material.
Refer Example Problem
The toughness of
For
Conclusion:
Thus, the 1020 steel specimen is tougher as compared to 1045 steel specimen.
Want to see more full solutions like this?
Chapter 6 Solutions
Materials Science and Engineering Properties, SI Edition


- can you answer both plss, i will give u a likearrow_forward*1-4. The hollow core panel is made from plain stone concrete. Determine the dead weight of the panel. The holes each have a diameter of 100 mm. 200 mm 300 mm 300 mm 300 mm 300 mm 300 mm Prob. 1-4 300 mm 4 marrow_forwardderive the expressions for V and M, and draw the shear forceandbendingmomentdiagrams.Neglecttheweightofthebeam.arrow_forward
- a. Draw trajectories of approximately 8 to 11 vehicles moving on a one way 1-lane road with different time-varying speeds. b. Consider a time-space window in the time-space diagram of part (a). See below. Denote the number of vehicles passing BD, DC, AC, and AB respectively as n1, N2, N3, and n4. Write an equation relating n₁, N2, N3, and n4 to each other. What is the physical intuition of this equation? Please elaborate. X 4 X. n4 n3 с n2 X1 D B n1 t c. Using density (k) definition at time instances t₁ and t₂ and flow (q) definition at locations X1 and X2, rewrite equation of interest in part (b) to demonstrate KAB-KCD 9BD-9AC + t₂-t1 x2-x1 = 0. d. What will be the equation in part (c), in case of x2 → x1 and t₂ → t₁.arrow_forwardConsider a city center where the traffic conditions are described by a Macroscopic Fundamental Diagram (MFD) of network outflow (g- rate of trips finished) vs. accumulation (n- number of cars) with a trapezoidal shape, as shown in the figure below. The values of the parameters are: • • maximum trip completion rate gmax=100 [veh/min] critical accumulations ncr1=1000 [veh] and ncr2=1500 [veh] jam accumulation njam=4000 [veh]. gmax ncr1 ncr2 njam There are two types of demands in the morning peak hour (7-8am): trips generated from outside the city center with rate q1=80 [veh/min], and trips generated from within the city center with rate q2=50 [veh/min]. In addition, a perimeter traffic control, u, is available that only restricts vehicles entering the city from outside. If at 7am there are already no=500 [veh] in the city center: a. Write the dynamic equations (mass conservation equation) in a continuous form for the center of the city. b. Convert the continuous dynamic into the discrete…arrow_forwardAssume a car park facility where the arrival rate is 1 customer every minute, and the service process including pressing the button, taking the card, and waiting for the boom to rise leads to service rate of μ customer every minute. a. Assume the arrival and service processes are stochastic. Using any software (Excel, Matlab, or the one you prefer), plot average delay time (including service time) and average queue size (including the vehicle currently being served) for all combinations of λ = {1,2,3,..,10} and p = {0.1,0.3,0.5,0.7,0.9}. Specifically, we ask you to make 2 graphs (one for average delay and the other for average queue size), where the x-axes contains the different values for 1, and where you make one curve for each p. b. Assume the arrival process is stochastic but the service process is deterministic with rate μ. Using any software (Excel, Matlab, or the one you prefer), plot average delay time (including service time) and average queue size (including the vehicle…arrow_forward
- A traffic signal has a 60-second cycle length (Red time + Green time). For the travel direction of interest, the red and green times are 30 seconds each, the arrival rate is constant at 20 [veh/min] and the saturation flow (i.e., the departure rate) is 1 [veh/sec]. a. Calculate the average delay (for all vehicles) for the travel direction of interest. b. Assume a work zone on the street downstream of the intersection so that only 25 [veh/min] (in the direction of interest) can pass. Calculate the average delay caused by the work zone to a vehicle leaving the intersection. Assume that the queue at the work zone never backs- up into the intersection. c. Discuss qualitatively the implications of queue spillback from the work zone on the delay of the system. Traffic Direction (a) Traffic Direction (b)arrow_forwardAttached pics is a sample problem, can you compute it for me, I just want to compare my answer. Thank you.arrow_forwardProblem 2: The Douglas fir beam below supports uniform live (WL) and dead loads (WD) as shown below. Assume the total distributed load is 700 lb/ft. WD=300#/PT. W₁ = 400# W₁ = 400#/FT- J J J J I J J J L=161 a) Assuming an alllowable deflection of L/360, compute the magnitude of the allowable deflection. b) Using an 8"x12" timber beam (see Table A1-b on page 567 of your text for properties) compute the actual deflection. Assume E = 1.6 x 100 psi. c) Based on your answers for parts a and b, determine if an 8"x12" timber beam is safe for this applicationarrow_forward
- Please use relationship method as I do not understand that one.arrow_forwardA freeway study resulted in a speed-density relationship: v=60(1-0.008k). Determine: a. The free-flow speed. b. The jam density. c. The speed-flow relationship. d. The flow-density relationship. e. The critical density. f. The capacity.arrow_forwardAverage Shear Stress BASIC FORMULAS General Shear Stress fv lb Shear Flow Flexural or Bending Stress VQ q Fb Mc M 1 Sx dtw fy-shear stress V = shear capacity d depth of the section tw = web thickness Radius of Gyration Q-statical moment of area Imoment of inertia of whole section b value of width where you cut Note: can be used to solve maximum shear stress Note: Maximum Shear Stress is located at the neutral axis (smallest width) Section Modulus Sx=x NOTE: If not given Fy 248 MPa for A36 Steel Fu-400 MPa for A36 Steel Es-200,000 MPa fb flexural or bending stress M-moment capacity I-Moment of Inertia of the whole section Sx-section modulus fy actual shear stress (from loads) Fv allowable shear stress (from NSCP) fv-Fv; safe and economical Vmax= P2 P Mmax = COMMON LOADINGS AND SUPPORTS PPP L/4 4↓1 44 L/4 PL PL Ymax = 48E1 Vmax = 1.5P Mmax = 22 PL 19PL Ymax = 384E1 P P [[ P P WL Vmax= 2 Mmax = P P L/3 ↓ L/3 ↓ L/3 WL' Swi Ymax = 384 ΕΙ PL 23PL Vmax = P Mmax = 이 Ymax =. 648E1arrow_forward
 Materials Science And Engineering PropertiesCivil EngineeringISBN:9781111988609Author:Charles GilmorePublisher:Cengage Learning
 Steel Design (Activate Learning with these NEW ti...Civil EngineeringISBN:9781337094740Author:Segui, William T.Publisher:Cengage Learning