Concept explainers
Videos
Three recessive traits in garden pea plants are as follows: yellow pods are recessive to green pods, bluish green seedlings are recessive to green seedlings, creeper (a plant that cannot stand up) is recessive to normal. A true-breeding normal plant with green pods and green seedlings was crossed to a creeper with yellow pods and bluish green seedlings. The
2059 green pods, green seedlings, normal
151 green pods, green seedlings, creeper
281 green pods, bluish green seedlings, normal
15 green pods, bluish green seedlings, creeper
2041 yellow pods, bluish green seedlings, creeper
157 yellow pods, bluish green seedlings, normal
282 yellow pods, green seedlings, creeper
11 yellow pods, green seedlings, normal
Construct a genetic map that indicates the map distances between these three genes.
To review:
A genetic map indicating map distances between the genes for pod color, seedling color, and plant stature.
Introduction:
Thepair of alleles ofa gene determines the protein encoded by the genes, and results in the phenotype of the trait. True breeders have the monomorphic condition for the alleles of a trait. A genetic map helps in describing the arrangement of the genes on a particular chromosome.
Explanation of Solution
A normal pea plant, which is truebreeding for green seedling and green pods is crossed with a creeper pea plant, having bluish-green seedlings and yellow pods. The F1 offspring are then crossed with a creeper having bluish-green seedlings and yellow pods.
Different characters of the pea plant can be denoted as follows:
Dominant characters: G for green pods, S for green seedling, and C for normal plants
Recessive characters: g for yellow pods, s for bluish green seedlings, and c for the creeper.
Given, the true breeding normal plant, having green seedlings as well as green pods is crossed with true breeding creeper, having bluish green seedling and yellow pods. The genotype of true breeding plants is GGSSCC and ggsscc. Thus, the gametes will be GSC and gsc. The plants in the F1 generation obtained by crossing these true breeders will be GgSsCc.
When three genes are linked then G, S, and C alleles will be linked together whereas g, s, and c alleles will be linked together, on a homologous chromosome. Given, the F1 plants GgSsCc are crossed with ggsscc (creepers having yellow pods and bluish green seedlings) and following results were obtained:
| Number of plants | Phenotype |
| 2059 | Green pods, green seedlings, normal |
| 151 | Green pods, green seedlings, creepers |
| 281 | Green pods, bluish green seedlings, normal |
| 15 | Green pods, bluish green seedlings, creepers |
| 2041 | Yellow pods, bluish green seedlings, creepers |
| 157 | Yellow pods, bluish green seedlings, normal |
| 282 | Yellow pods, green seedlings, creepers |
| 11 | Yellow pods, green seedlings, normal |
The genetic map for the three genes can be constructed by using the below-mentioned formula for map distance:
The distance between the three genes can be measured by separating the data of the offspring and phenotypic categories into gene pair, and then calculating the map distance between the two genes.
For the map distance between the genes for plant stature and pod color,
the number of offsprings is calculated for each pair of plant stature and color of pods.
Non-recombinant offspring are 2340 normal, green pods, and 2323 creeper, yellow pods.
Recombinant offspring are 166 creeper, green pods, and 168 normal, yellow pods.
Therefore, the map distance will be calculated as,
For the map distance between the genes for plant stature and seedling color, the number of offspring having genes for plant stature and color of the seedlingis given as follows:
Nonrecombinant offspring are 2070 normal, green seedlings, and 2056 creeper, bluish green seedlings, and the recombinant offspring are 433 creeper, green seedlings, and 438 normal, bluish green seedlings.
Therefore, the map distance will be calculated as.
For the map distance between the genes for seedling color and pod color, the number of offspring having genes for the color of seedling and pods is given as follows:
Non-recombinant offspring are 2210 green seedling, green pods, and 2198 bluish green seedling, yellow pods, and the recombinant offspring are 296 bluish green seedling, green pods, and 293 green seedling, yellow pods.Therefore, the map distance will be calculated as,
Thus, the distance between the genes for seedling and pods colors is 11.8 mu, and that between the genes for plant stature and seedling color is 17.4 mu and for the genes for plant stature and pod color, it is 6.7 mu. Therefore, the order of the three genes, according to the map distance in-between them will be seedling color, pod color, plant stature. Gene for pod color is present in the middle. Genetic map is shown below:
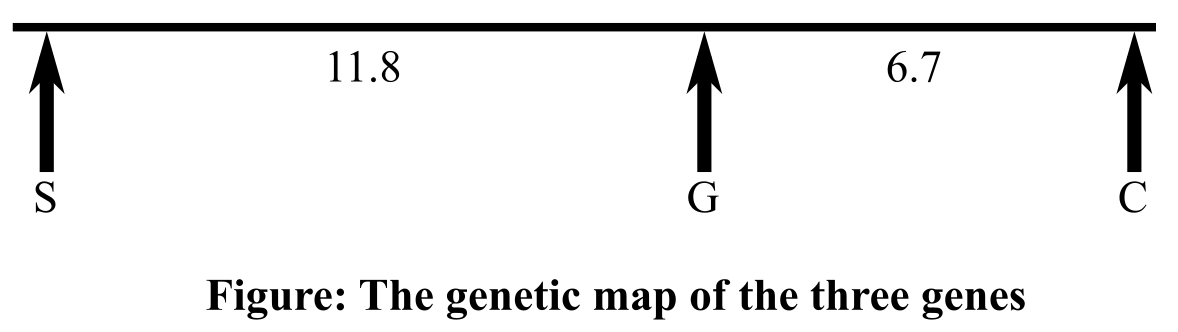
Therefore, it can be concluded that according to the map distance calculated in-between the genes for pod color, plant stature, and seedling color, the order of the three genes will be seedling color, pod color, plant stature(or the opposite order). The distance between the genes responsible for seedling and pods colors is 11.8 mu, and between the genes for plant stature and pod color, it is 6.7 mu. The genes that code for plant stature and seedling color are 17.4 mu apart.
Want to see more full solutions like this?
Chapter 6 Solutions
Genetics: Analysis and Principles


- The Oregon Wolfe Barley mapping population is unique in having 12 easily-scored morphological markers, each showing monogenic inheritance. Do you consider these markers useful? Briefly defend your answer, pointing out advantages and disadvantages of morphological vs. molecular markers.arrow_forwardBiopharmaceutics and Pharmacokinetics:Two-Compartment Model Instant Absorption Questions Calculate these : a) B1, b) B2, c) hybrid rate constant (1) d) hybrid rate constant (2) e) t1/2,dist f) t1/2,elim g) k10 h) k12 i) k21 j) initial concentration (C0) k) central compartment volume (V1) l) steady-state volume (Vss) m) clearance (CL) AUC (0→10 min) using trapezoidal rule n) AUC (20→30 min) using trapezoidal rule o) AUCtail (AUC360→∞) p) total AUC (using short cut method) q) volume from AUC (VAUC)arrow_forwardIn a population of Jackalopes (pictured below), horn length will vary between 0.5 and 2 feet, with the mean length somewhere around 1.05 feet. You pick Jackalopes that have horn lengths around 1.75 feet to breed as this appears to be the optimal length for battling other Jackalopes for food. After a round of breeding, you measure the offsprings' mean horn length is 1.67. What is the heritability of horns length (h2)? Is Jackalope horn length a heritable trait? (4 pts)? 12pt v R Paragraph V BIU A श्र > Barrow_forward
- There are many differences between DNA replication happening during mitosis in a Douglas fir tree growing in the Oregon Cascade Mountains and DNA replication happening during a PCR reaction in a forestry research lab at Oregon State University where the laboratory is amplifying a Simple Sequence Repeat. Complete the following table that compares the two DNA replication events in terms of the primers, the nucleotides, the polymerase, and the target sequence. Additionally, give a general value for the number of copies of the template DNA after one S phase in one cell and after the lab has completed the PCR reaction. Tree SSR Type your answer here: Primers Nucleotides Polymerase Target sequence Number of copiesarrow_forwardDescribe how insulin binding to its receptor induces glucose uptake in healthy individuals. Please specifyeach step in the cascade and use a diagram to illustrate the answer.arrow_forwardThere is a patient with breast cancer, after staining the breast tissue with H&E, state the molecular subtype of the tumour extracted. Results of H&E staining are down belowarrow_forward
- Biopharmaceutics and Pharmacokinetics:Two-Compartment Model Instant Absorption Questions Calculate these : a) B1, b) B2, c) hybrid rate constant (1) d) hybrid rate constant (2) e) t1/2,dist f) t1/2,elim g) k10 h) k12 i) k21 j) initial concentration (C0) k) central compartment volume (V1) l) steady-state volume (Vss) m) clearance (CL) AUC (0→10 min) using trapezoidal rule n) AUC (20→30 min) using trapezoidal rule o) AUCtail (AUC360→∞) p) total AUC (using short cut method) q) volume from AUC (VAUC)arrow_forwardUse the Henderson-Hasselbalch equation for a propanoic acid solution (CH₂CH₂CO₂H, pK₁ = 4.874) to calculate the quotient [A-]/[HA] at three different pH values. pH = 4.479 [A-] [HA] [A-] pH = 4.874 [HA] = pH = 5.220 [A-] = [HA]arrow_forwardIn order to establish the expiration date of perishable food, growth curve data must be collected. Once the microbial load is so high that it poses a hazard to human health, the food item is no longer considered safe (expired). Generally a load of x50,000 bacteria/gram is considered unsafe. Your task is to determine the microbial growth curves for MicroYo, a new brand of yogurt. The growth is determined by sampling the yogurt and growing the bacterial isolates in broth culture which is then serially diluted by a total of x10,000 and inoculated onto standard petri plates of nutrient agar. The following colony counts are measured: Time (days) MicroYo colony count# 1 1 4 1 12 2 16 20 4 7 What day should you recommend expiring the yogurt (the last possible date before the microbial load is unsafe). 12 4 20 16arrow_forward
- 9. Chicken combs in chickens is an example where you see interactions between genes. See potential genotypes and phenotypes below. Which genotype, when mated to a rose comb chicken, will produce progeny that are 50% walnut comb and 50% pea comb? walnut (RRPP) walnut (RrPP) pea (rrPP) walnut (RRPP) walnut (RrPp) pea (rrPp) rose rose single (RRPP) (Rrpp) (rrpp)arrow_forwardDescribe a compound light microscope and its importance in microbiology (2) examples of at least two microbes viewed under a compound light microscope and their general characteristics (note: the microbes you choose do not need to be the ones outlined in the above tutorial video) and (3) at least one source you used for the information included in your infographic.arrow_forwardPrice of visit Number of visits $700 0 $600 [1 $500 2 $400 3 $300 4 00000 The Table blow gives the demand curve for doctor visits for Elena. If the price of a doctor's visit is $600, and Elena does not have health insurance, she will visit the doctor times. If Elena obtains 50% coinsurance (the company pays 50% of the medical bill, Elena pays 50%), then Elena will visit the doctor times. 1; 2 0; 3 0; 2 1;4 2; 1arrow_forward
 Concepts of BiologyBiologyISBN:9781938168116Author:Samantha Fowler, Rebecca Roush, James WisePublisher:OpenStax College
 Human Heredity: Principles and Issues (MindTap Co...BiologyISBN:9781305251052Author:Michael CummingsPublisher:Cengage Learning
 Human Biology (MindTap Course List)BiologyISBN:9781305112100Author:Cecie Starr, Beverly McMillanPublisher:Cengage Learning
 Biology: The Dynamic Science (MindTap Course List)BiologyISBN:9781305389892Author:Peter J. Russell, Paul E. Hertz, Beverly McMillanPublisher:Cengage Learning
 Biology (MindTap Course List)BiologyISBN:9781337392938Author:Eldra Solomon, Charles Martin, Diana W. Martin, Linda R. BergPublisher:Cengage Learning
 Biology 2eBiologyISBN:9781947172517Author:Matthew Douglas, Jung Choi, Mary Ann ClarkPublisher:OpenStax