Concept explainers
Age versus Total Cholesterol The following data represent the age and average total cholesterol for adult males at various ages.
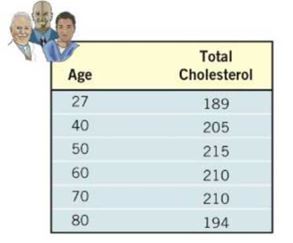
(a) Using a graphing utility, draw a
(b) Based on the scatter diagram drawn in part (a), decide on a model (linear, quadratic, cubic, exponential, logarithmic, or logistic) that you think best describes the relation between age and total cholesterol. Be sure to justify your choice of model.
(c) Using a graphing utility, find the model of best fit.
(d) Using a graphing utility, draw the model of best fit on the scatter diagram drawn in part (a).
(e) Use your model to predict the total cholesterol of a 35-year-old male.
Want to see the full answer?
Check out a sample textbook solutionChapter 5 Solutions
Precalculus
- What does the y -intercept on the graph of a logistic equation correspond to for a population modeled by that equation?arrow_forwardPls show work so I can understandarrow_forwardIdentify the description(s) that adhere to the requirements for testing a population correlation between variables X and Y. The log-transformed version of Y and X have a linear relationship. The shape of the scatter plot for the data collected for the X and Y variables is shaped like a funnel. The scatter plot for the data collected for the X and Y variables do not show any outliers. The frequency histograms for X and Y separately are each normally distributed.arrow_forward
- The data show the test results from students in two classrooms, one integrated and one not. There are two sets of test scores, a pre-test and a post-test for both groups. First, calculate a measure of change in the test scores for students in both groups. Then, use the resulting measure of change to compare both groups on the measure of change from the pre-test to the post-test. When finished, write a short summary of what you found, including: Group 1 mean Group 2 mean Ho and H1 t-observed t-criticalarrow_forwardHello! Please analyse the table 3 and 4 in the image attached. the data is supposed to see if there is a relationship between the prevalence of obesity(table3) or life expectancy (table4) between males and females. thank you!arrow_forwardThe data in the accompanying table is from observing the count of bacteria. The COUNT (Y) is recorded in 1000's of a BACTERIA (X₁) and the growth rate, RATE (X₂) of a type of bacteria. Below is the data set to be used for analysis. Y COUNT 9 9.1 10.2 11.3 12.2 10.6 X₁ BACTERIA A A C B B C 2.1. Change the dataset into a usable format for modelling. X₂ RATE 0.15 014 0.08 0.12 0.16 0.01arrow_forward
- A hydrologist is interested in studying the influence of rainfall on runoff in a drainage basin. Rainfall and runoff are measured during 20 rainfall events. Model the relationship. What are the variables and the type of measurement for these variables? slope (numerical) and itercept (numerical) dependent variable (nominal) and independent vatiable (nominal) Rainfall (total mm) and Runoff (liters/36 hours) geographic location (lat/long), area of watershed (hectares), and substrate type (rock/soil/vegitation) rainfall (numerical) and runoff (numerical)arrow_forwardA sales manager wants to examine the relationship between the number of daily customers (x) and the revenue generated (y). For this purpose, he made observations in a randomly chosen 6 days for a store and observed the number of daily customers and the revenue (1000 TL). The personally created data set for the x and y variables is included in the attached “Homework data” file. Using the data set defined on your behalf; x1 x2 x3 x4 x5 x6 y1 y2 y3 y4 y5 y6 sb1 Burak data 74 86 96 105 110 124 290 307 331 406 421 481 0.491 a) Create the regression equation b) Interpret b0 and b1 values c) Test and interpret whether there is a linear relationship between the number of daily customers and the income obtained at the level of α = 0.05 significance. Could you explain this question again and in more detail especially not in excel imagearrow_forwardStudies have shown that people who suffer sudden cardiac arrest have a better chance of survival if a defibrillator shock is administered very soon after cardiac arrest. How is survival rate related to the time between when cardiac arrest occurs and when the defibrillator shock is delivered? = survival rate (percent) and x = mean call-to-shock time (minutes) for a cardiac rehabilitation center (in which cardiac arrests occurred while victims were hospitalized The accompanying data give y and so the call-to-shock time tended to be short) and for four communities of different sizes. Mean call-to-shock time, x 2 6. 7 9. 12 Survival rate, y 91 46 32 4arrow_forward
- A popular television show recently released a video preview for the upcoming season on its website. As fans of the show discover the video, the number of views of the preview video has grown each day during the last 2 weeks. The number of days since the release of the video and the natural log of the number of video views is shown in the scatterplot. Based on the scatterplot and residual plot, what type of model would be appropriate for summarizing the relationship between days and number of views? An exponential model is appropriate because the residual plot does not show a clear pattern. A linear model is appropriate because the scatterplot shows a strong, positive linear relationship. A power model is appropriate because the scatterplot of days and natural log of views is strong and linear. An exponential model is appropriate because the relationship between days and the natural log of views is linear, and the residual plot does not show a clear pattern.arrow_forwardWhat is the scaling coefficient for the relationship between Drag Force (Fdrag) and Cross-Sectional Area (CSA)? What is the R2 value for the relationship between Drag Force (Fdrag) and Cross-Sectional Area (CSA)? What is the scaling coefficient for the relationship between Drag Force (Fdrag) and Drag Coefficient (Cdrag)? What is the R2 value for the relationship between Drag Force (Fdrag) and Drag Coefficient (Cdrag)?arrow_forwardAssume we have data demonstrating a strong linear link between the amount of fertilizer applied to certain plants and their yield. Which is the independent variable in this research question?arrow_forward
- Glencoe Algebra 1, Student Edition, 9780079039897...AlgebraISBN:9780079039897Author:CarterPublisher:McGraw HillAlgebra & Trigonometry with Analytic GeometryAlgebraISBN:9781133382119Author:SwokowskiPublisher:Cengage
- Big Ideas Math A Bridge To Success Algebra 1: Stu...AlgebraISBN:9781680331141Author:HOUGHTON MIFFLIN HARCOURTPublisher:Houghton Mifflin Harcourt