Concept explainers
Videos
a.
Two separate inequalities for the given statement.
a.
Answer to Problem 9CYU
Explanation of Solution
Given:
A number x is greater than 4, and the same number is less than 9.
Calculation:
In order to write the inequalities for the given statement, observe that the number x is greater than 4, so in algebraic notation it can be written as,
Also given that the same number x is less than 9, so in algebraic notation it can be represented by the inequality as
Thus, the inequalities for the given statement are
b.
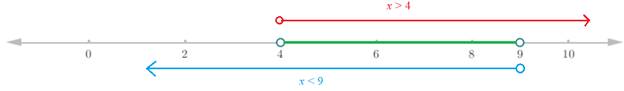
The graph of solution set by graphing the solution set of first inequality in red and solution set of second inequality in blue.
b.
Explanation of Solution
Given:
A number x is greater than 4, and the same number is less than 9.
Calculation:
The graph of the first inequality x > 4 is shown in red and the graph of the second inequality x < 9 is shown in blue. The region where they overlap is highlighted by green in the figure below,
c.
To make a table with ten points including points from each section.
c.
Answer to Problem 9CYU
| x | Both are true | ||
| 1 | False | True | False |
| 2 | False | True | False |
| 3 | False | True | False |
| 4 | False | True | False |
| 5 | True | True | True |
| 6 | True | True | True |
| 7 | True | True | True |
| 8 | True | True | True |
| 9 | True | False | False |
| 10 | True | False | False |
Explanation of Solution
Given:
A number x is greater than 4, and the same number is less than 9.
Calculation:
The table is shown below,
| x | Both are true | ||
| 1 | False | True | False |
| 2 | False | True | False |
| 3 | False | True | False |
| 4 | False | True | False |
| 5 | True | True | True |
| 6 | True | True | True |
| 7 | True | True | True |
| 8 | True | True | True |
| 9 | True | False | False |
| 10 | True | False | False |
d.
To describe the relationship between the colored regions of the graph and the chart.
d.
Explanation of Solution
Given:
A number x is greater than 4, and the same number is less than 9.
Calculation:
From the graph it is clear that the points between 4 and 9, excluding these points, satisfies both the inequalities. Also from the chart it is clear that the values between these two endpoints, both the inequalities holds true.
So, the colored region represents the solution of the combined inequalities.
Chapter 5 Solutions
Algebra 1
Additional Math Textbook Solutions
Calculus: Early Transcendentals (2nd Edition)
Thinking Mathematically (6th Edition)
Intro Stats, Books a la Carte Edition (5th Edition)
A Problem Solving Approach To Mathematics For Elementary School Teachers (13th Edition)
Elementary Statistics: Picturing the World (7th Edition)
Algebra and Trigonometry (6th Edition)


- Solve the following system of equations: 50x+20y=1800 10x+3y=300arrow_forward> > > we are hiring Salesforce Admin Location: Remote Key Responsibilities: Administer Salesforce Sales & Revenue Cloud (CPQ & Billing) Configure workflows, validation rules & dashboards Automate processes using Flows & Process Builder Collaborate with Sales, Finance & Marketing teams Manage user roles & security Apply: Hr@forcecraver.comarrow_forwardAnswer this questionarrow_forward
- 1. vector projection. Assume, ER1001 and you know the following: ||||=4, 7=-0.5.7. For each of the following, explicitly compute the value. འབ (a) (b) (c) (d) answer. Explicitly compute ||y7||. Explain your answer. Explicitly compute the cosine similarity of and y. Explain your Explicitly compute (x, y). Explain your answer. Find the projection of onto y and the projection of onto .arrow_forward2. Answer the following questions using vectors u and v. --0-0-0 = find the the cosine similarity and the angle between u and v. འརྒྱ (a) (b) find the scalar projection of u onto v. (c) find the projection of u onto v. (d) (e) (f) find the scalar projection of onto u. find the projection of u onto u. find the projection of u onto and the projection of onto . (Hint: find the inner product and verify the orthogonality)arrow_forwardPlease type out answerarrow_forward
- The function f(x) = log x is transformed to produce g(x) = log (x) – 3. Identify the type of transformation and describe the change. Please type out answerarrow_forwardEach graph below is the graph of a system of three linear equations in three unknowns of the form Ax = b. Determine whether each system has a solution and, if it does, the number of free variables. A. O free variables ✓ B. no solution C. no solution D. no solution E. 1 free variable F. 1 free variablearrow_forwardSolve the following systems of equations and show all work.y = x2 + 3y = x + 5 Please type out answerarrow_forward
 Algebra and Trigonometry (6th Edition)AlgebraISBN:9780134463216Author:Robert F. BlitzerPublisher:PEARSON
 Contemporary Abstract AlgebraAlgebraISBN:9781305657960Author:Joseph GallianPublisher:Cengage Learning
 Linear Algebra: A Modern IntroductionAlgebraISBN:9781285463247Author:David PoolePublisher:Cengage Learning
 Algebra And Trigonometry (11th Edition)AlgebraISBN:9780135163078Author:Michael SullivanPublisher:PEARSON
 Introduction to Linear Algebra, Fifth EditionAlgebraISBN:9780980232776Author:Gilbert StrangPublisher:Wellesley-Cambridge Press
 College Algebra (Collegiate Math)AlgebraISBN:9780077836344Author:Julie Miller, Donna GerkenPublisher:McGraw-Hill Education