Videos
Write the process of solving and linear graphing.
Answer to Problem 55HP
Explanation of Solution
Concept Used:
Rules for solving inequality equations:
These things do not affect the direction of the inequality:
- Add (or subtract) a number from both sides
- Multiply (or divide) both sides by a positive number
- Simplify a side
But these things do change the direction of the inequality ("
- Multiply (or divide) both sides by a negative number
- Swapping left and right hand sides
For Inequality equation: If
Example:
| Steps | Explanation |
| Original equation Subtract 14 from both sides. Divide each side by 2 Solution:
| |
| Original Equation Subtract 7x from both sides.
|
Here is a summary of how to graph inequalities:
1) Draw a number line.2) Put either an open circle or a closed dot above the number given.
For ≤ and ≥ , use a closed dot to indicate the number itself is part of the solution.
For < and >, use an open circle to indicate the number itself is not part of the solution.
3) Choose which way the arrow should go. Either think about which numbers would be part of the solution. Or, as long as the variable is listed first, you can just look at the symbol
For ≤ and <, the arrow points down to the left.
For ≥ and >, the arrow points up to the right.
|
Plotting inequalities: To plot an inequality: Such as x>3, on a number line, first draw a circle over the number (e.g., 3). Then if the sign includes equal to (= or =), fill in the circle (solid circle). If the sign does not include equal to (> or <), leave the circle (hollow circle) unfilled in. For x < 3 or x >3, there is a hollow circle. For | 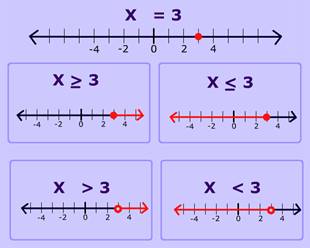 |
Thus, solving linear inequalities is similar to solving linear equations. You must isolate the variable on one side of the inequality.
To graph, if the problem is a less than or a greater than inequality, an open circle is used. Otherwise a dot is used.
If the variable is on the left hand side of the inequality, and the inequality sign is less than (or less than or equal to), the graph extends to the left; otherwise it extends to the right.
Chapter 5 Solutions
Algebra 1
Additional Math Textbook Solutions
Elementary Statistics (13th Edition)
Introductory Statistics
Elementary Statistics: Picturing the World (7th Edition)
Calculus: Early Transcendentals (2nd Edition)
A Problem Solving Approach To Mathematics For Elementary School Teachers (13th Edition)
Pre-Algebra Student Edition


- Solve the following system of equations: 50x+20y=1800 10x+3y=300arrow_forward> > > we are hiring Salesforce Admin Location: Remote Key Responsibilities: Administer Salesforce Sales & Revenue Cloud (CPQ & Billing) Configure workflows, validation rules & dashboards Automate processes using Flows & Process Builder Collaborate with Sales, Finance & Marketing teams Manage user roles & security Apply: Hr@forcecraver.comarrow_forwardAnswer this questionarrow_forward
- 1. vector projection. Assume, ER1001 and you know the following: ||||=4, 7=-0.5.7. For each of the following, explicitly compute the value. འབ (a) (b) (c) (d) answer. Explicitly compute ||y7||. Explain your answer. Explicitly compute the cosine similarity of and y. Explain your Explicitly compute (x, y). Explain your answer. Find the projection of onto y and the projection of onto .arrow_forward2. Answer the following questions using vectors u and v. --0-0-0 = find the the cosine similarity and the angle between u and v. འརྒྱ (a) (b) find the scalar projection of u onto v. (c) find the projection of u onto v. (d) (e) (f) find the scalar projection of onto u. find the projection of u onto u. find the projection of u onto and the projection of onto . (Hint: find the inner product and verify the orthogonality)arrow_forwardPlease type out answerarrow_forward
- The function f(x) = log x is transformed to produce g(x) = log (x) – 3. Identify the type of transformation and describe the change. Please type out answerarrow_forwardEach graph below is the graph of a system of three linear equations in three unknowns of the form Ax = b. Determine whether each system has a solution and, if it does, the number of free variables. A. O free variables ✓ B. no solution C. no solution D. no solution E. 1 free variable F. 1 free variablearrow_forwardSolve the following systems of equations and show all work.y = x2 + 3y = x + 5 Please type out answerarrow_forward
 Algebra and Trigonometry (6th Edition)AlgebraISBN:9780134463216Author:Robert F. BlitzerPublisher:PEARSON
 Contemporary Abstract AlgebraAlgebraISBN:9781305657960Author:Joseph GallianPublisher:Cengage Learning
 Linear Algebra: A Modern IntroductionAlgebraISBN:9781285463247Author:David PoolePublisher:Cengage Learning
 Algebra And Trigonometry (11th Edition)AlgebraISBN:9780135163078Author:Michael SullivanPublisher:PEARSON
 Introduction to Linear Algebra, Fifth EditionAlgebraISBN:9780980232776Author:Gilbert StrangPublisher:Wellesley-Cambridge Press
 College Algebra (Collegiate Math)AlgebraISBN:9780077836344Author:Julie Miller, Donna GerkenPublisher:McGraw-Hill Education