Concept explainers
(A)
To draw:
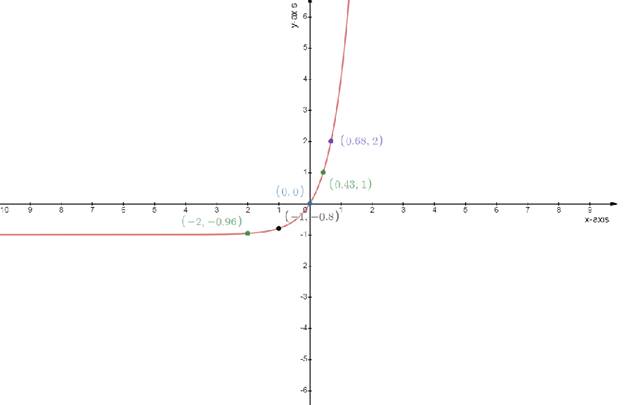
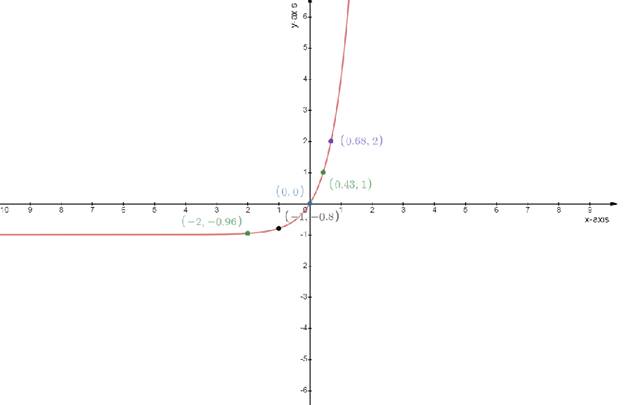
The graph of the given function
(A)
Explanation of Solution
Given:
The function is
Concept used:
Definition of the
The derivative of a function
Calculation:
The function
Draw the table
Test one point in each of the region formed by the graph
If the point satisfies the function then shade the entire region to denote that every point in the region satisfies the function

(B)
To draw:
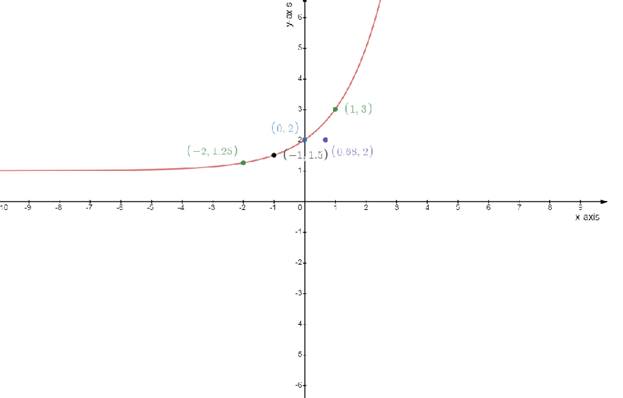
The graph of the given function
(B)
Explanation of Solution
Given:
The function is
Concept used:
Definition of the differentiation:-Differentiation is the action of computing a derivative
The derivative of a function
Calculation:
The function
Draw the table
Test one point in each of the region formed by the graph
If the point satisfies the function then shade the entire region to denote that every point in the region satisfies the function

(C)
To draw:
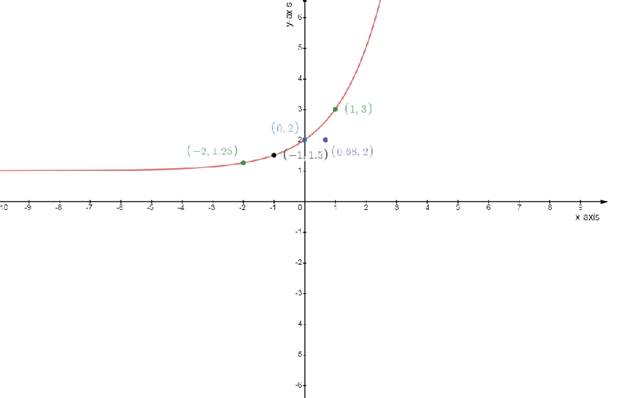
The graph of the given function
(C)
Explanation of Solution
Given:
The function is
Concept used:
Definition of the differentiation:-Differentiation is the action of computing a derivative
The derivative of a function
Calculation:
Draw the table
Test one point in each of the region formed by the graph
If the point satisfies the function then shade the entire region to denote that every point in the region satisfies the function

Draw the table
Test one point in each of the region formed by the graph
If the point satisfies the function then shade the entire region to denote that every point in the region satisfies the function

Chapter 5 Solutions
Precalculus
Additional Math Textbook Solutions
Thinking Mathematically (6th Edition)
A Problem Solving Approach To Mathematics For Elementary School Teachers (13th Edition)
Pre-Algebra Student Edition
University Calculus: Early Transcendentals (4th Edition)
- nd ave a ction and ave an 48. The domain of f y=f'(x) x 1 2 (= x<0 x<0 = f(x) possible. Group Activity In Exercises 49 and 50, do the following. (a) Find the absolute extrema of f and where they occur. (b) Find any points of inflection. (c) Sketch a possible graph of f. 49. f is continuous on [0,3] and satisfies the following. X 0 1 2 3 f 0 2 0 -2 f' 3 0 does not exist -3 f" 0 -1 does not exist 0 ve tes where X 0 < x <1 1< x <2 2arrow_forwardNumerically estimate the value of limx→2+x3−83x−9, rounded correctly to one decimal place. In the provided table below, you must enter your answers rounded exactly to the correct number of decimals, based on the Numerical Conventions for MATH1044 (see lecture notes 1.3 Actions page 3). If there are more rows provided in the table than you need, enter NA for those output values in the table that should not be used. x→2+ x3−83x−9 2.1 2.01 2.001 2.0001 2.00001 2.000001arrow_forwardFind the general solution of the given differential equation. (1+x)dy/dx - xy = x +x2arrow_forwardEstimate the instantaneous rate of change of the function f(x) = 2x² - 3x − 4 at x = -2 using the average rate of change over successively smaller intervals.arrow_forwardGiven the graph of f(x) below. Determine the average rate of change of f(x) from x = 1 to x = 6. Give your answer as a simplified fraction if necessary. For example, if you found that msec = 1, you would enter 1. 3' −2] 3 -5 -6 2 3 4 5 6 7 Ꮖarrow_forwardGiven the graph of f(x) below. Determine the average rate of change of f(x) from x = -2 to x = 2. Give your answer as a simplified fraction if necessary. For example, if you found that msec = , you would enter 3 2 2 3 X 23arrow_forwardA function is defined on the interval (-π/2,π/2) by this multipart rule: if -π/2 < x < 0 f(x) = a if x=0 31-tan x +31-cot x if 0 < x < π/2 Here, a and b are constants. Find a and b so that the function f(x) is continuous at x=0. a= b= 3arrow_forwardUse the definition of continuity and the properties of limits to show that the function is continuous at the given number a. f(x) = (x + 4x4) 5, a = -1 lim f(x) X--1 = lim x+4x X--1 lim X-1 4 x+4x 5 ))" 5 )) by the power law by the sum law lim (x) + lim X--1 4 4x X-1 -(0,00+( Find f(-1). f(-1)=243 lim (x) + -1 +4 35 4 ([ ) lim (x4) 5 x-1 Thus, by the definition of continuity, f is continuous at a = -1. by the multiple constant law by the direct substitution propertyarrow_forward1. Compute Lo F⚫dr, where and C is defined by F(x, y) = (x² + y)i + (y − x)j r(t) = (12t)i + (1 − 4t + 4t²)j from the point (1, 1) to the origin.arrow_forward2. Consider the vector force: F(x, y, z) = 2xye²i + (x²e² + y)j + (x²ye² — z)k. (A) [80%] Show that F satisfies the conditions for a conservative vector field, and find a potential function (x, y, z) for F. Remark: To find o, you must use the method explained in the lecture. (B) [20%] Use the Fundamental Theorem for Line Integrals to compute the work done by F on an object moves along any path from (0,1,2) to (2, 1, -8).arrow_forwardhelp pleasearrow_forwardIn each of Problems 1 through 4, draw a direction field for the given differential equation. Based on the direction field, determine the behavior of y as t → ∞. If this behavior depends on the initial value of y at t = 0, describe the dependency.1. y′ = 3 − 2yarrow_forwardarrow_back_iosSEE MORE QUESTIONSarrow_forward_ios
 Calculus: Early TranscendentalsCalculusISBN:9781285741550Author:James StewartPublisher:Cengage Learning
 Thomas' Calculus (14th Edition)CalculusISBN:9780134438986Author:Joel R. Hass, Christopher E. Heil, Maurice D. WeirPublisher:PEARSON
 Calculus: Early Transcendentals (3rd Edition)CalculusISBN:9780134763644Author:William L. Briggs, Lyle Cochran, Bernard Gillett, Eric SchulzPublisher:PEARSON
 Calculus: Early TranscendentalsCalculusISBN:9781319050740Author:Jon Rogawski, Colin Adams, Robert FranzosaPublisher:W. H. Freeman
 Calculus: Early Transcendental FunctionsCalculusISBN:9781337552516Author:Ron Larson, Bruce H. EdwardsPublisher:Cengage Learning


