
a)
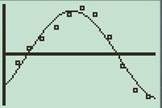
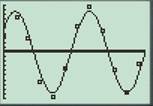
To plot: The scatterplot of the given data of day of the year and time as the number of minutes past 18:30.
The scatterplot of the given data is shown below.
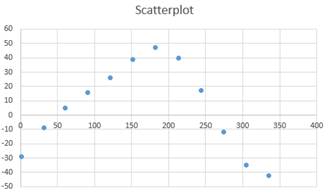
Given:The data of the year and time as the number of minutes past 18:30 is shown below
| Day | 18:30+ |
| 1 | -29 |
| 32 | -9 |
| 60 | 5 |
| 91 | 16 |
| 121 | 26 |
| 152 | 39 |
| 182 | 47 |
| 213 | 40 |
| 244 | 17 |
| 274 | -12 |
| 305 | -35 |
| 335 | -42 |
Plot:The data of the day of the year in L1 and the number of minutes past 18:30 in L2 and using this data a scatterplot is plotted as shown below
b)
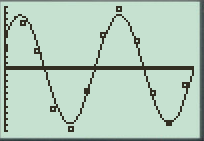
To plot: Superimpose the graph on the scatterplot and verify if it is a good fit.
The superimposing of the graph on scatterplot is shown below
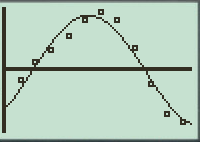
The model looks like a good fit.
Plot:
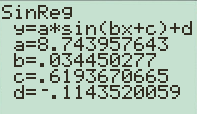
Press “STAT” in the calculator and then go to “CALC” menu and choose SinReg function and click enter. Select the data entered in L1 and L2 to plot the curve and click ok to get the following output and graph
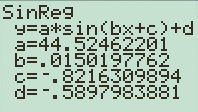
Interpretation:With reference to Sin regression output the regression equation is
c)
To calculate: The predicted y value and also the residual values for the given data.
The predicted values and residuals for the given data are shown below
| L1 (Day) | L2 (18:30+) | L3 | L4 |
| 1 | -29 | -32.68 | 3.68 |
| 32 | -9 | -15.44 | 6.44 |
| 60 | 5 | 2.97 | 2.03 |
| 91 | 16 | 22.49 | -6.49 |
| 121 | 26 | 36.76 | -10.76 |
| 152 | 39 | 43.66 | -4.66 |
| 182 | 47 | 41.40 | 5.60 |
| 213 | 40 | 30.30 | 9.70 |
| 244 | 17 | 12.64 | 4.36 |
| 274 | -12 | -7.17 | -4.83 |
| 305 | -35 | -26.22 | -8.78 |
| 335 | -42 | -39.50 | -2.50 |
Plot:
With reference to the data given in L1 and L2, column L3 shows the predicted values and column L4 shows residuals.
The predicted value in L3 is calculated by plugging in the values of x, and y in the regression equation as shown below
Similarly, for all values column L3 is created in the calculator and in column L4 the residuals are calculated using
| L1 (Day) | L2 (18:30+) | L3 | L4 |
| 1 | -29 | -32.68 | 3.68 |
| 32 | -9 | -15.44 | 6.44 |
| 60 | 5 | 2.97 | 2.03 |
| 91 | 16 | 22.49 | -6.49 |
| 121 | 26 | 36.76 | -10.76 |
| 152 | 39 | 43.66 | -4.66 |
| 182 | 47 | 41.40 | 5.60 |
| 213 | 40 | 30.30 | 9.70 |
| 244 | 17 | 12.64 | 4.36 |
| 274 | -12 | -7.17 | -4.83 |
| 305 | -35 | -26.22 | -8.78 |
| 335 | -42 | -39.50 | -2.50 |
d)
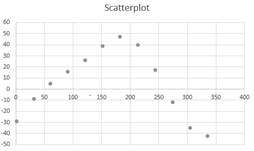
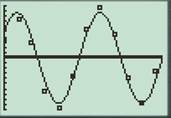
To plot: The scatterplot of the given data of day of the year in L1 and the residuals in L3.
The scatterplot of the data in L1 and the residuals is shown below
The sine regression equation is
Plot:The data of the day of the year in L1 and the residuals in L3 are used to generate the regression output by clicking on STAT and then to CALC menu. In the options mentioned SinReg option is selected and the appropriate data is entered and a scatterplot is plotted as shown below
e)
To Interpret: The two scatterplots obtained for the data in L1, L2 and L1, L3.
The two scatterplots of the data in L1, L2 and L1, L3 are shown below

Both regressions indicate that the behaviour of the sunset as a function of time is sinusoidal.
Interpretation:
With reference to previous parts the scatter plots of the data L1, L2, and L1, L3 both have a sinusoidal graph. Thus there exists a periodic behavior of sunset with respect to time.
Chapter 5 Solutions
Precalculus: Graphical, Numerical, Algebraic Common Core 10th Edition

- Each of the following statements is an attempt to show that a given series is convergent or divergent using the Comparison Test (NOT the Limit Comparison Test.) For each statement, enter C (for "correct") if the argument is valid, or enter | (for "incorrect") if any part of the argument is flawed. (Note: if the conclusion is true but the argument that led to it was wrong, you must enter I.) ☐ 1. For all n > 1, seriesΣ In(n) In(n) converges. 2, 1, arctan(n) the series arctan(n) n³ ☐ 4. For all n > 1, 123 converges. 1 n ln(n) series In(n) diverges. 2n . and the seriesΣconverges, so by the Comparison Test, 2, 3, and the series converges, so by the Comparison Test, the series-3 1 converges. ☐ 6. For all n > 2, In(n) >, and the series Σ converges, so by the Comparison Test, the seriesΣ In(n) converges.arrow_forwardInstructions. "I have written solutions in text form, but I need experts to rewrite them in handwriting from A to Z, exactly as I have written, without any changes."arrow_forwardBoth in images okk. Instructions. "I have written solutions in text form, but I need experts to rewrite them in handwriting from A to Z, exactly as I have written, without any changes."arrow_forward
- Question 1: If a barometer were built using oil (p = 0.92 g/cm³) instead of mercury (p = 13.6 g/cm³), would the column of oil be higher than, lower than, or the same as the column of mercury at 1.00 atm? If the level is different, by what factor? Explain. (5 pts) Solution: A barometer works based on the principle that the pressure exerted by the liquid column balances atmospheric pressure. The pressure is given by: P = pgh Since the atmospheric pressure remains constant (P = 1.00 atm), the height of the liquid column is inversely proportional to its density: Step 1: Given Data PHg hol=hgx Poil • Density of mercury: PHg = 13.6 g/cm³ Density of oil: Poil = 0.92 g/cm³ • Standard height of mercury at 1.00 atm: hμg Step 2: Compute Height of Oil = 760 mm = 0.760 m 13.6 hoil = 0.760 x 0.92 hoil = 0.760 × 14.78 hoil = 11.23 m Step 3: Compare Heights Since oil is less dense than mercury, the column of oil must be much taller than that of mercury. The factor by which it is taller is: Final…arrow_forwardQuestion 3: A sealed flask at room temperature contains a mixture of neon (Ne) and nitrogen (N2) gases. Ne has a mass of 3.25 g and exerts a pressure of 48.2 torr. . N2 contributes a pressure of 142 torr. • What is the mass of the N2 in the flask? • Atomic mass of Ne = 20.1797 g/mol • Atomic mass of N = 14.0067 g/mol Solution: We will use the Ideal Gas Law to determine the number of moles of each gas and calculate the mass of N2. PV = nRT where: • P = total pressure • V volume of the flask (same for both gases) n = number of moles of gas • R 0.0821 L atm/mol K • T = Room temperature (assume 298 K) Since both gases are in the same flask, their partial pressures correspond to their mole fractions. Step 1: Convert Pressures to Atmospheres 48.2 PNe = 0.0634 atm 760 142 PN2 = = 0.1868 atm 760 Step 2: Determine Moles of Ne nNe = mass molar mass 3.25 nNe 20.1797 nne 0.1611 mol Step 3: Use Partial Pressure Ratio to Find narrow_forward"I have written solutions in text form, but I need experts to rewrite them in handwriting from A to Z, exactly as I have written, without any changes."arrow_forward
- 3.12 (B). A horizontal beam AB is 4 m long and of constant flexural rigidity. It is rigidly built-in at the left-hand end A and simply supported on a non-yielding support at the right-hand end B. The beam carries Uniformly distributed vertical loading of 18 kN/m over its whole length, together with a vertical downward load of 10KN at 2.5 m from the end A. Sketch the S.F. and B.M. diagrams for the beam, indicating all main values. Cl. Struct. E.] CS.F. 45,10,376 KN, B.M. 186, +36.15 kNm.7arrow_forwardQize f(x) = x + 2x2 - 2 x² + 4x²² - Solve the equation using Newton Raphsonarrow_forward-b±√√b2-4ac 2a @4x²-12x+9=0 27 de febrero de 2025 -b±√√b2-4ac 2a ⑥2x²-4x-1=0 a = 4 b=-12 c=9 a = 2 b = 9 c = \ x=-42±√(2-4 (4) (9) 2(4)) X = (12) ±√44)-(360) 2(108) x = ±√ X = =±√√²-4(2) (1) 2() X = ±√ + X = X = + X₁ = = X₁ = X₁ = + X₁ = = =arrow_forward
- 3.9 (A/B). A beam ABCDE, with A on the left, is 7 m long and is simply supported at Band E. The lengths of the various portions are AB 1-5m, BC = 1-5m, CD = 1 m and DE : 3 m. There is a uniformly distributed load of 15kN/m between B and a point 2m to the right of B and concentrated loads of 20 KN act at 4 and 0 with one of 50 KN at C. (a) Draw the S.F. diagrams and hence determine the position from A at which the S.F. is zero. (b) Determine the value of the B.M. at this point. (c) Sketch the B.M. diagram approximately to scale, quoting the principal values. [3.32 m, 69.8 KNm, 0, 30, 69.1, 68.1, 0 kNm.]arrow_forward4. Verify that V X (aẢ) = (Va) XẢ + aV X Ả where Ả = xyz(x + y + 2) A and a = 3xy + 4zx by carrying out the detailed differentiations.arrow_forward3. For each of the arrow or quiver graphs shown below, determine analytically V°C and V X Č. From these analytical solutions, identify the extrema (+/-) and plot these points on the arrow graph. (a) C = −✰CosxSiny + ŷSinxCosy -π<ׂу<π Ty (b) C = −xSin2y + ŷCos2y x, y<π -π< (c) C = −xCosx + ŷSiny -π< x, y < πarrow_forward
 Calculus: Early TranscendentalsCalculusISBN:9781285741550Author:James StewartPublisher:Cengage Learning
 Thomas' Calculus (14th Edition)CalculusISBN:9780134438986Author:Joel R. Hass, Christopher E. Heil, Maurice D. WeirPublisher:PEARSON
 Calculus: Early Transcendentals (3rd Edition)CalculusISBN:9780134763644Author:William L. Briggs, Lyle Cochran, Bernard Gillett, Eric SchulzPublisher:PEARSON
 Calculus: Early TranscendentalsCalculusISBN:9781319050740Author:Jon Rogawski, Colin Adams, Robert FranzosaPublisher:W. H. Freeman
 Calculus: Early Transcendental FunctionsCalculusISBN:9781337552516Author:Ron Larson, Bruce H. EdwardsPublisher:Cengage Learning