
Elementary Statistics: Picturing the World (7th Edition)
7th Edition
ISBN: 9780134683416
Author: Ron Larson, Betsy Farber
Publisher: PEARSON
expand_more
expand_more
format_list_bulleted
Concept explainers
Videos
Textbook Question
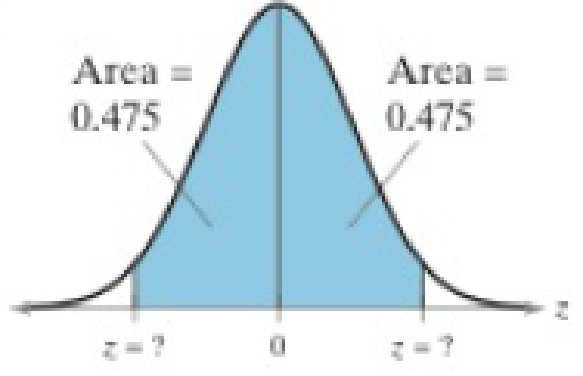
Chapter 5.3, Problem 21E
Graphical Analysis In Exercises 17–22, find the indicated z-score(s) shown in the graph.
21. 
Expert Solution & Answer
Want to see the full answer?
Check out a sample textbook solution
Students have asked these similar questions
In order to find probability, you can use this formula in Microsoft Excel:
The best way to understand and solve these problems is by first drawing a bell curve and marking key points such as x, the mean, and the areas of interest. Once marked on the bell curve, figure out what calculations are needed to find the area of interest.
=NORM.DIST(x, Mean, Standard Dev., TRUE).
When the question mentions “greater than” you may have to subtract your answer from 1.
When the question mentions “between (two values)”, you need to do separate calculation for both values and then subtract their results to get the answer.
1.
Compute the probability of a value between 44.0 and 55.0.
(The question requires finding probability value between 44 and 55. Solve it in 3 steps.
In the first step, use the above formula and x = 44, calculate probability value.
In the second step repeat the first step with the only difference that x=55.
In the third step, subtract the answer of the first part from the…
If a uniform distribution is defined over the interval from 6 to 10, then answer the followings:
What is the mean of this uniform distribution?
Show that the probability of any value between 6 and 10 is equal to 1.0
Find the probability of a value more than 7.
Find the probability of a value between 7 and 9.
The closing price of Schnur Sporting Goods Inc. common stock is uniformly distributed between $20 and $30 per share. What is the probability that the stock price will be:
More than $27?
Less than or equal to $24?
The April rainfall in Flagstaff, Arizona, follows a uniform distribution between 0.5 and 3.00 inches.
What is the mean amount of rainfall for the month?
What is the probability of less than an inch of rain for the month?
What is the probability of exactly 1.00 inch of rain?
What is the probability of more than 1.50 inches of rain for the month?
The best way to solve this problem is begin by creating a chart. Clearly mark the range, identifying the lower and upper…
Problem 1:
The mean hourly pay of an American Airlines flight attendant is normally distributed with a mean of 40 per hour and a standard deviation of 3.00 per hour. What is the probability that the hourly pay of a randomly selected flight attendant is:
Between the mean and $45 per hour?
More than $45 per hour?
Less than $32 per hour?
Problem 2:
The mean of a normal probability distribution is 400 pounds. The standard deviation is 10 pounds.
What is the area between 415 pounds and the mean of 400 pounds?
What is the area between the mean and 395 pounds?
What is the probability of randomly selecting a value less than 395 pounds?
Problem 3:
In New York State, the mean salary for high school teachers in 2022 was 81,410 with a standard deviation of 9,500. Only Alaska’s mean salary was higher. Assume New York’s state salaries follow a normal distribution.
What percent of New York State high school teachers earn between 70,000 and 75,000?
What percent of New York State high school…
Chapter 5 Solutions
Elementary Statistics: Picturing the World (7th Edition)
Ch. 5.1 - 1. Which normal curve has the greatest mean? 2....Ch. 5.1 - The scaled test scores for the New York State...Ch. 5.1 - A U.S. adult who is at least 20 years old is...Ch. 5.1 - Find the area under the standard normal curve to...Ch. 5.1 - Find the area under the standard normal curve to...Ch. 5.1 - Find the area under the standard normal curve...Ch. 5.1 - Find three real-life examples of a continuous...Ch. 5.1 - In a normal distribution, which is greater, the...Ch. 5.1 - What is the total area under the normal curve?Ch. 5.1 - What do the inflection points on a normal...
Ch. 5.1 - Draw two normal curves that have the same mean but...Ch. 5.1 - Draw two normal curves that have different means...Ch. 5.1 - What is the mean of the standard normal...Ch. 5.1 - Describe how you can transform a nonstandard...Ch. 5.1 - Getting at the Concept Why is it correct to say a...Ch. 5.1 - Getting at the Concept A z-score is 0. Which of...Ch. 5.1 - Graphical Analysis In Exercises 1116, determine...Ch. 5.1 - Graphical Analysis In Exercises 1116, determine...Ch. 5.1 - Graphical Analysis In Exercises 1116, determine...Ch. 5.1 - Graphical Analysis In Exercises 1116, determine...Ch. 5.1 - Graphical Analysis In Exercises 1116, determine...Ch. 5.1 - Graphical Analysis In Exercises 1116, determine...Ch. 5.1 - Finding Area In Exercises 1722, find the area of...Ch. 5.1 - Finding Area In Exercises 1722, find the area of...Ch. 5.1 - Finding Area In Exercises 1722, find the area of...Ch. 5.1 - Finding Area In Exercises 1722, find the area of...Ch. 5.1 - Finding Area In Exercises 1722, find the area of...Ch. 5.1 - Finding Area In Exercises 1722, find the area of...Ch. 5.1 - Finding Area In Exercises 2336, find the indicated...Ch. 5.1 - Finding Area In Exercises 2336, find the indicated...Ch. 5.1 - Finding Area In Exercises 2336, find the indicated...Ch. 5.1 - Finding Area In Exercises 2336, find the indicated...Ch. 5.1 - Finding Area In Exercises 2336, find the indicated...Ch. 5.1 - Finding Area In Exercises 2336, find the indicated...Ch. 5.1 - Finding Area In Exercises 2336, find the indicated...Ch. 5.1 - Finding Area In Exercises 2336, find the indicated...Ch. 5.1 - Finding Area In Exercises 2336, find the indicated...Ch. 5.1 - Finding Area In Exercises 2336, find the indicated...Ch. 5.1 - Finding Area In Exercises 2336, find the indicated...Ch. 5.1 - Finding Area In Exercises 2336, find the indicated...Ch. 5.1 - Finding Area In Exercises 2336, find the indicated...Ch. 5.1 - Finding Area In Exercises 2336, find the indicated...Ch. 5.1 - Manufacturer Claims You work for a consumer...Ch. 5.1 - Milk Consumption You are performing a study about...Ch. 5.1 - Computing and Interpreting z-Scores In Exercises...Ch. 5.1 - Computing and Interpreting z-Scores In Exercises...Ch. 5.1 - Finding Probability In Exercises 4146, find the...Ch. 5.1 - Finding Probability In Exercises 4146, find the...Ch. 5.1 - Finding Probability In Exercises 4146, find the...Ch. 5.1 - Finding Probability In Exercises 4146, find the...Ch. 5.1 - Finding Probability In Exercises 4146, find the...Ch. 5.1 - Finding Probability In Exercises 4146, find the...Ch. 5.1 - Finding Probability In Exercises 4756, find the...Ch. 5.1 - Finding Probability In Exercises 4756, find the...Ch. 5.1 - Finding Probability In Exercises 4756, find the...Ch. 5.1 - Finding Probability In Exercises 4756, find the...Ch. 5.1 - Finding Probability In Exercises 4756, find the...Ch. 5.1 - Finding Probability In Exercises 4756, find the...Ch. 5.1 - Finding Probability In Exercises 4756, find the...Ch. 5.1 - Finding Probability In Exercises 4756, find the...Ch. 5.1 - Finding Probability In Exercises 4756, find the...Ch. 5.1 - Finding Probability In Exercises 4756, find the...Ch. 5.1 - Writing Draw a normal curve with a mean of 60 and...Ch. 5.1 - Writing Draw a normal curve with a mean of 450 and...Ch. 5.1 - Prob. 59ECh. 5.1 - Uniform Distribution A uniform distribution is a...Ch. 5.2 - The average speed of vehicles traveling on a...Ch. 5.2 - What is the probability that the shopper in...Ch. 5.2 - Find the cumulative area that corresponds to a...Ch. 5.2 - Computing Probabilities for Normal Distributions...Ch. 5.2 - Computing Probabilities for Normal Distributions...Ch. 5.2 - Computing Probabilities for Normal Distributions...Ch. 5.2 - Computing Probabilities for Normal Distributions...Ch. 5.2 - Computing Probabilities for Normal Distributions...Ch. 5.2 - Computing Probabilities for Normal Distributions...Ch. 5.2 - Finding Probabilities for Normal Distributions In...Ch. 5.2 - Finding Probabilities for Normal Distributions In...Ch. 5.2 - Finding Probabilities for Normal Distributions In...Ch. 5.2 - Finding Probabilities for Normal Distributions In...Ch. 5.2 - Finding Probabilities for Normal Distributions In...Ch. 5.2 - Finding Probabilities for Normal Distributions In...Ch. 5.2 - Graphical Analysis In Exercises 1316, a member is...Ch. 5.2 - Graphical Analysis In Exercises 1316, a member is...Ch. 5.2 - Graphical Analysis In Exercises 1316, a member is...Ch. 5.2 - Graphical Analysis In Exercises 1316, a member is...Ch. 5.2 - Using Normal Distributions In Exercises 1720,...Ch. 5.2 - Using Normal Distributions In Exercises 1720,...Ch. 5.2 - Using Normal Distributions In Exercises 1720,...Ch. 5.2 - Using Normal Distributions In Exercises 1720,...Ch. 5.2 - In Exercises 2124, a control chart is shown. Each...Ch. 5.2 - In Exercises 2124, a control chart is shown. Each...Ch. 5.2 - In Exercises 2124, a control chart is shown. Each...Ch. 5.2 - In Exercises 2124, a control chart is shown. Each...Ch. 5.3 - 1. Find the z-score that has 96.16% of the...Ch. 5.3 - Find the z-score that corresponds to each...Ch. 5.3 - A veterinarian records the weights of dogs treated...Ch. 5.3 - A researcher tests the braking distances of...Ch. 5.3 - The lengths of time employees have worked at a...Ch. 5.3 - Finding a z-Score In Exercises 116, use the...Ch. 5.3 - Finding a z-Score In Exercises 116, use the...Ch. 5.3 - Prob. 3ECh. 5.3 - Finding a z-Score In Exercises 116, use the...Ch. 5.3 - Prob. 5ECh. 5.3 - Prob. 6ECh. 5.3 - Prob. 7ECh. 5.3 - Finding a z-Score In Exercises 116, use the...Ch. 5.3 - Prob. 9ECh. 5.3 - Finding a z-Score In Exercises 116, use the...Ch. 5.3 - Finding a z-Score In Exercises 116, use the...Ch. 5.3 - Finding a z-Score In Exercises 116, use the...Ch. 5.3 - Prob. 13ECh. 5.3 - Prob. 14ECh. 5.3 - Prob. 15ECh. 5.3 - Prob. 16ECh. 5.3 - Graphical Analysis In Exercises 1722, find the...Ch. 5.3 - Graphical Analysis In Exercises 1722, find the...Ch. 5.3 - Prob. 19ECh. 5.3 - Graphical Analysis In Exercises 1722, find the...Ch. 5.3 - Graphical Analysis In Exercises 1722, find the...Ch. 5.3 - Graphical Analysis In Exercises 1722, find the...Ch. 5.3 - Finding a z-Score Given an Area In Exercises 2330,...Ch. 5.3 - Finding a z-Score Given an Area In Exercises 2330,...Ch. 5.3 - Finding a z-Score Given an Area In Exercises 2330,...Ch. 5.3 - Finding a z-Score Given an Area In Exercises 2330,...Ch. 5.3 - Finding a z-Score Given an Area In Exercises 2330,...Ch. 5.3 - Finding a z-Score Given an Area In Exercises 2330,...Ch. 5.3 - Find the positive z-score for which 80% of the...Ch. 5.3 - Find the positive z-score for which 12% of the...Ch. 5.3 - Finding Specified Data Values In Exercises 3138,...Ch. 5.3 - Finding Specified Data Values In Exercises 3138,...Ch. 5.3 - Finding Specified Data Values In Exercises 3138,...Ch. 5.3 - Finding Specified Data Values In Exercises 3138,...Ch. 5.3 - Undergraduate Grade Point Average The...Ch. 5.3 - GRE Scores The test scores for the analytical...Ch. 5.3 - Finding Specified Data Values In Exercises 3138,...Ch. 5.3 - Finding Specified Data Values In Exercises 3138,...Ch. 5.3 - Bags of Baby Carrots The weights of bags of baby...Ch. 5.3 - Writing a Guarantee You sell a brand of automobile...Ch. 5.3 - Vending Machine A vending machine dispenses coffee...Ch. 5.3 - History Grades In a large section of a history...Ch. 5.3 - CASE STUDY Birth Weights in America The National...Ch. 5.3 - CASE STUDY Birth Weights in America The National...Ch. 5.3 - CASE STUDY Birth Weights in America The National...Ch. 5.3 - CASE STUDY Birth Weights in America The National...Ch. 5.3 - Prob. 5CSCh. 5.4 - List all possible samples of size n = 3. with...Ch. 5.4 - Random samples of size 64 are drawn from the...Ch. 5.4 - The diameters of fully grown white oak trees are...Ch. 5.4 - You randomly select 100 drivers ages 16 to 19 from...Ch. 5.4 - The average sales price of a single-family house...Ch. 5.4 - A consumer price analyst claims that prices for...Ch. 5.4 - In Exercises 14, a population has a mean and a...Ch. 5.4 - In Exercises 14, a population has a mean and a...Ch. 5.4 - In Exercises 14, a population has a mean and a...Ch. 5.4 - In Exercises 14, a population has a mean and a...Ch. 5.4 - True or False? In Exercises 58, determine whether...Ch. 5.4 - True or False? In Exercises 58, determine whether...Ch. 5.4 - True or False? In Exercises 58, determine whether...Ch. 5.4 - True or False? In Exercises 58, determine whether...Ch. 5.4 - Graphical Analysis In Exercises 9 and 10, the...Ch. 5.4 - Graphical Analysis In Exercises 9 and 10, the...Ch. 5.4 - A Sampling Distribution of Sample Means In...Ch. 5.4 - A Sampling Distribution of Sample Means In...Ch. 5.4 - A Sampling Distribution of Sample Means In...Ch. 5.4 - A Sampling Distribution of Sample Means In...Ch. 5.4 - Finding Probabilities In Exercises 1518, the...Ch. 5.4 - Finding Probabilities In Exercises 1518, the...Ch. 5.4 - Finding Probabilities In Exercises 1518, the...Ch. 5.4 - Finding Probabilities In Exercises 1518, the...Ch. 5.4 - Interpreting the Central Limit Theorem In...Ch. 5.4 - Interpreting the Central Limit Theorem In...Ch. 5.4 - Interpreting the Central Limit Theorem In...Ch. 5.4 - Interpreting the Central Limit Theorem In...Ch. 5.4 - Interpreting the Central Limit Theorem In...Ch. 5.4 - Interpreting the Central Limit Theorem In...Ch. 5.4 - Interpreting the Central Limit Theorem In...Ch. 5.4 - Interpreting the Central Limit Theorem In...Ch. 5.4 - Repeat Exercise 19 for samples of size 40 and 60....Ch. 5.4 - Repeat Exercise 20 for samples of size 72 and 108....Ch. 5.4 - Finding Probabilities for Sampling Distributions...Ch. 5.4 - Finding Probabilities for Sampling Distributions...Ch. 5.4 - Finding Probabilities for Sampling Distributions...Ch. 5.4 - Finding Probabilities for Sampling Distributions...Ch. 5.4 - Which Is More Likely? Assume that the childhood...Ch. 5.4 - Which Is More Likely? Assume that the carbon...Ch. 5.4 - Paint Cans A machine is set to fill paint cans...Ch. 5.4 - Milk Containers A machine is set to fill milk...Ch. 5.4 - Finding Probabilities for Sampling Distributions...Ch. 5.4 - Finding Probabilities for Sampling Distributions...Ch. 5.4 - In Exercises 39 and 40, determine whether the...Ch. 5.4 - In Exercises 39 and 40, determine whether the...Ch. 5.4 - Sampling Distribution of Sample Proportions For a...Ch. 5.4 - Sampling Distribution of Sample Proportions For a...Ch. 5.4 - Run the simulation using n = 30 and N = 10 for a...Ch. 5.4 - Run the simulation using n = 50 and N = 10 for a...Ch. 5.5 - A binomial experiment is listed. Determine whether...Ch. 5.5 - Use a continuity correction to convert each...Ch. 5.5 - In a survey of adults in the United States, 29%...Ch. 5.5 - In Example 4, what is the probability that at most...Ch. 5.5 - The study in Example 5 found that 32.0% of all men...Ch. 5.5 - In Exercises 14, the sample size n,. probability...Ch. 5.5 - In Exercises 14, the sample size n,. probability...Ch. 5.5 - Prob. 3ECh. 5.5 - Prob. 4ECh. 5.5 - In Exercises 5-8, match the binomial probability...Ch. 5.5 - In Exercises 5-8, match the binomial probability...Ch. 5.5 - In Exercises 5-8, match the binomial probability...Ch. 5.5 - In Exercises 5-8, match the binomial probability...Ch. 5.5 - In Exercises 9-14, write the binomial probability...Ch. 5.5 - In Exercises 9-14, write the binomial probability...Ch. 5.5 - In Exercises 9-14, write the binomial probability...Ch. 5.5 - In Exercises 9-14, write the binomial probability...Ch. 5.5 - In Exercises 9-14, write the binomial probability...Ch. 5.5 - In Exercises 9-14, write the binomial probability...Ch. 5.5 - Graphical Analysis In Exercises 15 and 16, write...Ch. 5.5 - Graphical Analysis In Exercises 15 and 16, write...Ch. 5.5 - Approximating a Binomial Distribution In Exercises...Ch. 5.5 - Approximating a Binomial Distribution In Exercises...Ch. 5.5 - Approximating Binomial Probabilities In Exercises...Ch. 5.5 - Approximating Binomial Probabilities In Exercises...Ch. 5.5 - Approximating Binomial Probabilities In Exercises...Ch. 5.5 - Approximating Binomial Probabilities In Exercises...Ch. 5.5 - Approximating Binomial Probabilities In Exercises...Ch. 5.5 - Approximating Binomial Probabilities In Exercises...Ch. 5.5 - Approximating Binomial Probabilities In Exercises...Ch. 5.5 - Approximating Binomial Probabilities In Exercises...Ch. 5.5 - Minimum Wage About 3.3% of hourly paid U.S....Ch. 5.5 - Education A survey of U.S. adults found that 8%...Ch. 5.5 - Getting Physical The figure shows the results of a...Ch. 5.5 - Getting Physical The figure shows the results of a...Ch. 5.5 - Testing a Drug A drug manufacturer claims that a...Ch. 5.5 - Testing a Drug A drug manufacturer claims that a...Ch. 5 - Is It Unusual? A population is normally...Ch. 5 - Find the Error The mean age of students at a high...Ch. 5 - Give an example of a distribution that might be...Ch. 5 - In Exercises I and 2, use the normal curve to...Ch. 5 - In Exercises I and 2, use the normal curve to...Ch. 5 - In Exercises 3 and 4, use the normal curves shown...Ch. 5 - Prob. 5.1.4RECh. 5 - In Exercises 5 and 6, find the area of the...Ch. 5 - In Exercises 5 and 6, find the area of the...Ch. 5 - In Exercises 7-18, find the indicated area under...Ch. 5 - In Exercises 7-18, find the indicated area under...Ch. 5 - In Exercises 7-18, find the indicated area under...Ch. 5 - In Exercises 7-18, find the indicated area under...Ch. 5 - In Exercises 7-18, find the indicated area under...Ch. 5 - In Exercises 7-18, find the indicated area under...Ch. 5 - In Exercises 7-18, find the indicated area under...Ch. 5 - In Exercises 7-18, find the indicated area under...Ch. 5 - In Exercises 7-18, find the indicated area under...Ch. 5 - In Exercises 7-18, find the indicated area under...Ch. 5 - In Exercises 7-18, find the indicated area under...Ch. 5 - In Exercises 7-18, find the indicated area under...Ch. 5 - The scores for the reading portion of the ACT test...Ch. 5 - The scores for the reading portion of the ACT test...Ch. 5 - In Exercises 21-26, find the indicated probability...Ch. 5 - In Exercises 21-26, find the indicated probability...Ch. 5 - In Exercises 21-26, find the indicated probability...Ch. 5 - In Exercises 21-26, find the indicated probability...Ch. 5 - In Exercises 21-26, find the indicated probability...Ch. 5 - In Exercises 21-26, find the indicated probability...Ch. 5 - In Exercises 2732, the random variable x is...Ch. 5 - In Exercises 2732, the random variable x is...Ch. 5 - In Exercises 2732, the random variable x is...Ch. 5 - In Exercises 2732, the random variable x is...Ch. 5 - In Exercises 2732, the random variable x is...Ch. 5 - In Exercises 2732, the random variable x is...Ch. 5 - In Exercises 33 and 34, find the indicated...Ch. 5 - In Exercises 33 and 34, find the indicated...Ch. 5 - Determine whether any of the events in Exercise 33...Ch. 5 - Determine whether any of the events in Exercise 34...Ch. 5 - In Exercises 3742, use the Standard Normal Table...Ch. 5 - In Exercises 3742, use the Standard Normal Table...Ch. 5 - In Exercises 3742, use the Standard Normal Table...Ch. 5 - In Exercises 3742, use the Standard Normal Table...Ch. 5 - In Exercises 3742, use the Standard Normal Table...Ch. 5 - In Exercises 3742, use the Standard Normal Table...Ch. 5 - In Exercises 3742, use the Standard Normal Table...Ch. 5 - In Exercises 3742, use the Standard Normal Table...Ch. 5 - On a dry surface, the braking distances (in feet),...Ch. 5 - On a dry surface, the braking distances (in feet),...Ch. 5 - Prob. 5.3.47RECh. 5 - On a dry surface, the braking distances (in feet),...Ch. 5 - On a dry surface, the braking distances (in feet),...Ch. 5 - Prob. 5.3.50RECh. 5 - In Exercises 51 and 52, a population and sample...Ch. 5 - In Exercises 51 and 52, a population and sample...Ch. 5 - Prob. 5.4.53RECh. 5 - Prob. 5.4.54RECh. 5 - In Exercises 5560, find the indicated...Ch. 5 - In Exercises 5560, find the indicated...Ch. 5 - In Exercises 5560, find the indicated...Ch. 5 - In Exercises 5560, find the indicated...Ch. 5 - Prob. 5.4.59RECh. 5 - Prob. 5.4.60RECh. 5 - Prob. 5.5.61RECh. 5 - Prob. 5.5.62RECh. 5 - In Exercises 63-68, write the binomial probability...Ch. 5 - In Exercises 63-68, write the binomial probability...Ch. 5 - In Exercises 63-68, write the binomial probability...Ch. 5 - In Exercises 63-68, write the binomial probability...Ch. 5 - In Exercises 63-68, write the binomial probability...Ch. 5 - Prob. 5.5.68RECh. 5 - In Exercises 69 and 70, determine whether you can...Ch. 5 - In Exercises 69 and 70, determine whether you can...Ch. 5 - Find each probability using the standard normal...Ch. 5 - The random variable x is normally distributed with...Ch. 5 - In a standardized IQ test, scores are normally...Ch. 5 - In a standardized IQ test, scores are normally...Ch. 5 - In a standardized IQ test, scores are normally...Ch. 5 - In a standardized IQ test, scores are normally...Ch. 5 - In a standardized IQ test, scores are normally...Ch. 5 - In a standardized IQ test, scores are normally...Ch. 5 - In a standardized IQ test, scores are normally...Ch. 5 - Are you more likely to randomly select one person...Ch. 5 - In a survey of U.S. adults, 16% say they have had...Ch. 5 - In a survey of U.S. adults, 16% say they have had...Ch. 5 - Prob. 1CTCh. 5 - In Exercises 2-4, the random variable x is...Ch. 5 - In Exercises 2-4, the random variable x is...Ch. 5 - In Exercises 2-4, the random variable x is...Ch. 5 - In Exercises 5 and 6. determine whether you can...Ch. 5 - In Exercises 5 and 6. determine whether you can...Ch. 5 - The per capita disposable income for residents of...Ch. 5 - The per capita disposable income for residents of...Ch. 5 - The per capita disposable income for residents of...Ch. 5 - The per capita disposable income for residents of...Ch. 5 - EXERCISES 1. Sampling Individuals Assume the...Ch. 5 - Sampling Groups of Five Assume the machine shifts...Ch. 5 - Writing an Explanation Write a paragraph to your...Ch. 5 - A survey of adults in the United States found that...Ch. 5 - Prob. 2CRCh. 5 - In Exercises 2 and 3, find the (a) mean, (b)...Ch. 5 - Use the probability distribution in Exercise 3 to...Ch. 5 - From a pool of 16 candidates, 9 men and 7 women,...Ch. 5 - In Exercises 6-11, find the indicated area under...Ch. 5 - In Exercises 6-11, find the indicated area under...Ch. 5 - In Exercises 6-11, find the indicated area under...Ch. 5 - In Exercises 6-11, find the indicated area under...Ch. 5 - Prob. 10CRCh. 5 - In Exercises 6-11, find the indicated area under...Ch. 5 - Twenty-eight percent of U.S. adults think that...Ch. 5 - Prob. 13CRCh. 5 - Prob. 14CRCh. 5 - A survey of adults in the United States found that...Ch. 5 - The life spans of car batteries are normally...Ch. 5 - A florist has 12 different flowers from which...Ch. 5 - Seventy percent of U.S. adults anticipate major...
Knowledge Booster


Learn more about
Need a deep-dive on the concept behind this application? Look no further. Learn more about this topic, statistics and related others by exploring similar questions and additional content below.Similar questions
- Pls help asaparrow_forwardSolve the following LP problem using the Extreme Point Theorem: Subject to: Maximize Z-6+4y 2+y≤8 2x + y ≤10 2,y20 Solve it using the graphical method. Guidelines for preparation for the teacher's questions: Understand the basics of Linear Programming (LP) 1. Know how to formulate an LP model. 2. Be able to identify decision variables, objective functions, and constraints. Be comfortable with graphical solutions 3. Know how to plot feasible regions and find extreme points. 4. Understand how constraints affect the solution space. Understand the Extreme Point Theorem 5. Know why solutions always occur at extreme points. 6. Be able to explain how optimization changes with different constraints. Think about real-world implications 7. Consider how removing or modifying constraints affects the solution. 8. Be prepared to explain why LP problems are used in business, economics, and operations research.arrow_forwardged the variance for group 1) Different groups of male stalk-eyed flies were raised on different diets: a high nutrient corn diet vs. a low nutrient cotton wool diet. Investigators wanted to see if diet quality influenced eye-stalk length. They obtained the following data: d Diet Sample Mean Eye-stalk Length Variance in Eye-stalk d size, n (mm) Length (mm²) Corn (group 1) 21 2.05 0.0558 Cotton (group 2) 24 1.54 0.0812 =205-1.54-05T a) Construct a 95% confidence interval for the difference in mean eye-stalk length between the two diets (e.g., use group 1 - group 2).arrow_forward
- An article in Business Week discussed the large spread between the federal funds rate and the average credit card rate. The table below is a frequency distribution of the credit card rate charged by the top 100 issuers. Credit Card Rates Credit Card Rate Frequency 18% -23% 19 17% -17.9% 16 16% -16.9% 31 15% -15.9% 26 14% -14.9% Copy Data 8 Step 1 of 2: Calculate the average credit card rate charged by the top 100 issuers based on the frequency distribution. Round your answer to two decimal places.arrow_forwardPlease could you check my answersarrow_forwardLet Y₁, Y2,, Yy be random variables from an Exponential distribution with unknown mean 0. Let Ô be the maximum likelihood estimates for 0. The probability density function of y; is given by P(Yi; 0) = 0, yi≥ 0. The maximum likelihood estimate is given as follows: Select one: = n Σ19 1 Σ19 n-1 Σ19: n² Σ1arrow_forward
- Please could you help me answer parts d and e. Thanksarrow_forwardWhen fitting the model E[Y] = Bo+B1x1,i + B2x2; to a set of n = 25 observations, the following results were obtained using the general linear model notation: and 25 219 10232 551 XTX = 219 10232 3055 133899 133899 6725688, XTY 7361 337051 (XX)-- 0.1132 -0.0044 -0.00008 -0.0044 0.0027 -0.00004 -0.00008 -0.00004 0.00000129, Construct a multiple linear regression model Yin terms of the explanatory variables 1,i, x2,i- a) What is the value of the least squares estimate of the regression coefficient for 1,+? Give your answer correct to 3 decimal places. B1 b) Given that SSR = 5550, and SST=5784. Calculate the value of the MSg correct to 2 decimal places. c) What is the F statistics for this model correct to 2 decimal places?arrow_forwardCalculate the sample mean and sample variance for the following frequency distribution of heart rates for a sample of American adults. If necessary, round to one more decimal place than the largest number of decimal places given in the data. Heart Rates in Beats per Minute Class Frequency 51-58 5 59-66 8 67-74 9 75-82 7 83-90 8arrow_forward
- can someone solvearrow_forwardQUAT6221wA1 Accessibility Mode Immersiv Q.1.2 Match the definition in column X with the correct term in column Y. Two marks will be awarded for each correct answer. (20) COLUMN X Q.1.2.1 COLUMN Y Condenses sample data into a few summary A. Statistics measures Q.1.2.2 The collection of all possible observations that exist for the random variable under study. B. Descriptive statistics Q.1.2.3 Describes a characteristic of a sample. C. Ordinal-scaled data Q.1.2.4 The actual values or outcomes are recorded on a random variable. D. Inferential statistics 0.1.2.5 Categorical data, where the categories have an implied ranking. E. Data Q.1.2.6 A set of mathematically based tools & techniques that transform raw data into F. Statistical modelling information to support effective decision- making. 45 Q Search 28 # 00 8 LO 1 f F10 Prise 11+arrow_forwardStudents - Term 1 - Def X W QUAT6221wA1.docx X C Chat - Learn with Chegg | Cheg X | + w:/r/sites/TertiaryStudents/_layouts/15/Doc.aspx?sourcedoc=%7B2759DFAB-EA5E-4526-9991-9087A973B894% QUAT6221wA1 Accessibility Mode பg Immer The following table indicates the unit prices (in Rands) and quantities of three consumer products to be held in a supermarket warehouse in Lenasia over the time period from April to July 2025. APRIL 2025 JULY 2025 PRODUCT Unit Price (po) Quantity (q0)) Unit Price (p₁) Quantity (q1) Mineral Water R23.70 403 R25.70 423 H&S Shampoo R77.00 922 R79.40 899 Toilet Paper R106.50 725 R104.70 730 The Independent Institute of Education (Pty) Ltd 2025 Q Search L W f Page 7 of 9arrow_forward
arrow_back_ios
SEE MORE QUESTIONS
arrow_forward_ios
Recommended textbooks for you
 Big Ideas Math A Bridge To Success Algebra 1: Stu...AlgebraISBN:9781680331141Author:HOUGHTON MIFFLIN HARCOURTPublisher:Houghton Mifflin Harcourt
 Glencoe Algebra 1, Student Edition, 9780079039897...AlgebraISBN:9780079039897Author:CarterPublisher:McGraw Hill
 Trigonometry (MindTap Course List)TrigonometryISBN:9781305652224Author:Charles P. McKeague, Mark D. TurnerPublisher:Cengage Learning

 Trigonometry (MindTap Course List)TrigonometryISBN:9781337278461Author:Ron LarsonPublisher:Cengage Learning
Big Ideas Math A Bridge To Success Algebra 1: Stu...
Algebra
ISBN:9781680331141
Author:HOUGHTON MIFFLIN HARCOURT
Publisher:Houghton Mifflin Harcourt
Glencoe Algebra 1, Student Edition, 9780079039897...
Algebra
ISBN:9780079039897
Author:Carter
Publisher:McGraw Hill
Trigonometry (MindTap Course List)
Trigonometry
ISBN:9781305652224
Author:Charles P. McKeague, Mark D. Turner
Publisher:Cengage Learning
Trigonometry (MindTap Course List)
Trigonometry
ISBN:9781337278461
Author:Ron Larson
Publisher:Cengage Learning
Which is the best chart: Selecting among 14 types of charts Part II; Author: 365 Data Science;https://www.youtube.com/watch?v=qGaIB-bRn-A;License: Standard YouTube License, CC-BY