
Elementary Statistics: Picturing the World (7th Edition)
7th Edition
ISBN: 9780134683416
Author: Ron Larson, Betsy Farber
Publisher: PEARSON
expand_more
expand_more
format_list_bulleted
Concept explainers
Videos
Textbook Question
Chapter 5.3, Problem 18E
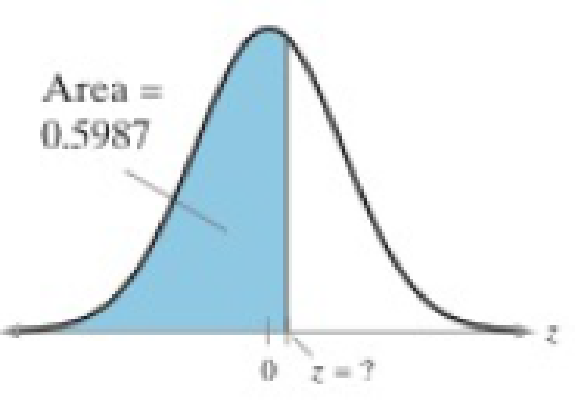
Graphical Analysis In Exercises 17–22, find the indicated z-score(s) shown in the graph.
18. 
Expert Solution & Answer
Want to see the full answer?
Check out a sample textbook solution
Students have asked these similar questions
«
CENGAGE MINDTAP
Quiz: Chapter 38
Assignment: Quiz: Chapter 38
ips
Questions ra1kw08h_ch38.15m
13.
14.
15.
O
Which sentence has modifiers in the correct place?
O a. When called, she for a medical emergency responds quickly.
b. Without giving away too much of the plot, Helena described the heroine's actions in the film.
O c. Nearly the snakebite victim died before the proper antitoxin was injected.
. O
O
16
16.
O
17.
18.
O
19.
O
20
20.
21
21.
22.
22
DS
23.
23
24.
25.
O
O
O
Questions ra1kw08h_ch36.14m
12.
13.
14.
15.
16.
Ӧ
17.
18.
19.
OS
20.
Two separate sentences need
Oa. two separate subjects.
Ob. two dependent clauses.
c. one shared subject.
Customers experiencing technical difficulty with their Internet cable service may call an 800 number for technical support. It takes the technician between 30 seconds and 11 minutes to resolve the problem. The distribution of this support time follows the uniform distribution.
Required:
a. What are the values for a and b in minutes?
Note: Do not round your intermediate calculations. Round your answers to 1 decimal place.
b-1. What is the mean time to resolve the problem?
b-2. What is the standard deviation of the time?
c. What percent of the problems take more than 5 minutes to resolve?
d. Suppose we wish to find the middle 50% of the problem-solving times. What are the end points of these two times?
Chapter 5 Solutions
Elementary Statistics: Picturing the World (7th Edition)
Ch. 5.1 - 1. Which normal curve has the greatest mean? 2....Ch. 5.1 - The scaled test scores for the New York State...Ch. 5.1 - A U.S. adult who is at least 20 years old is...Ch. 5.1 - Find the area under the standard normal curve to...Ch. 5.1 - Find the area under the standard normal curve to...Ch. 5.1 - Find the area under the standard normal curve...Ch. 5.1 - Find three real-life examples of a continuous...Ch. 5.1 - In a normal distribution, which is greater, the...Ch. 5.1 - What is the total area under the normal curve?Ch. 5.1 - What do the inflection points on a normal...
Ch. 5.1 - Draw two normal curves that have the same mean but...Ch. 5.1 - Draw two normal curves that have different means...Ch. 5.1 - What is the mean of the standard normal...Ch. 5.1 - Describe how you can transform a nonstandard...Ch. 5.1 - Getting at the Concept Why is it correct to say a...Ch. 5.1 - Getting at the Concept A z-score is 0. Which of...Ch. 5.1 - Graphical Analysis In Exercises 1116, determine...Ch. 5.1 - Graphical Analysis In Exercises 1116, determine...Ch. 5.1 - Graphical Analysis In Exercises 1116, determine...Ch. 5.1 - Graphical Analysis In Exercises 1116, determine...Ch. 5.1 - Graphical Analysis In Exercises 1116, determine...Ch. 5.1 - Graphical Analysis In Exercises 1116, determine...Ch. 5.1 - Finding Area In Exercises 1722, find the area of...Ch. 5.1 - Finding Area In Exercises 1722, find the area of...Ch. 5.1 - Finding Area In Exercises 1722, find the area of...Ch. 5.1 - Finding Area In Exercises 1722, find the area of...Ch. 5.1 - Finding Area In Exercises 1722, find the area of...Ch. 5.1 - Finding Area In Exercises 1722, find the area of...Ch. 5.1 - Finding Area In Exercises 2336, find the indicated...Ch. 5.1 - Finding Area In Exercises 2336, find the indicated...Ch. 5.1 - Finding Area In Exercises 2336, find the indicated...Ch. 5.1 - Finding Area In Exercises 2336, find the indicated...Ch. 5.1 - Finding Area In Exercises 2336, find the indicated...Ch. 5.1 - Finding Area In Exercises 2336, find the indicated...Ch. 5.1 - Finding Area In Exercises 2336, find the indicated...Ch. 5.1 - Finding Area In Exercises 2336, find the indicated...Ch. 5.1 - Finding Area In Exercises 2336, find the indicated...Ch. 5.1 - Finding Area In Exercises 2336, find the indicated...Ch. 5.1 - Finding Area In Exercises 2336, find the indicated...Ch. 5.1 - Finding Area In Exercises 2336, find the indicated...Ch. 5.1 - Finding Area In Exercises 2336, find the indicated...Ch. 5.1 - Finding Area In Exercises 2336, find the indicated...Ch. 5.1 - Manufacturer Claims You work for a consumer...Ch. 5.1 - Milk Consumption You are performing a study about...Ch. 5.1 - Computing and Interpreting z-Scores In Exercises...Ch. 5.1 - Computing and Interpreting z-Scores In Exercises...Ch. 5.1 - Finding Probability In Exercises 4146, find the...Ch. 5.1 - Finding Probability In Exercises 4146, find the...Ch. 5.1 - Finding Probability In Exercises 4146, find the...Ch. 5.1 - Finding Probability In Exercises 4146, find the...Ch. 5.1 - Finding Probability In Exercises 4146, find the...Ch. 5.1 - Finding Probability In Exercises 4146, find the...Ch. 5.1 - Finding Probability In Exercises 4756, find the...Ch. 5.1 - Finding Probability In Exercises 4756, find the...Ch. 5.1 - Finding Probability In Exercises 4756, find the...Ch. 5.1 - Finding Probability In Exercises 4756, find the...Ch. 5.1 - Finding Probability In Exercises 4756, find the...Ch. 5.1 - Finding Probability In Exercises 4756, find the...Ch. 5.1 - Finding Probability In Exercises 4756, find the...Ch. 5.1 - Finding Probability In Exercises 4756, find the...Ch. 5.1 - Finding Probability In Exercises 4756, find the...Ch. 5.1 - Finding Probability In Exercises 4756, find the...Ch. 5.1 - Writing Draw a normal curve with a mean of 60 and...Ch. 5.1 - Writing Draw a normal curve with a mean of 450 and...Ch. 5.1 - Prob. 59ECh. 5.1 - Uniform Distribution A uniform distribution is a...Ch. 5.2 - The average speed of vehicles traveling on a...Ch. 5.2 - What is the probability that the shopper in...Ch. 5.2 - Find the cumulative area that corresponds to a...Ch. 5.2 - Computing Probabilities for Normal Distributions...Ch. 5.2 - Computing Probabilities for Normal Distributions...Ch. 5.2 - Computing Probabilities for Normal Distributions...Ch. 5.2 - Computing Probabilities for Normal Distributions...Ch. 5.2 - Computing Probabilities for Normal Distributions...Ch. 5.2 - Computing Probabilities for Normal Distributions...Ch. 5.2 - Finding Probabilities for Normal Distributions In...Ch. 5.2 - Finding Probabilities for Normal Distributions In...Ch. 5.2 - Finding Probabilities for Normal Distributions In...Ch. 5.2 - Finding Probabilities for Normal Distributions In...Ch. 5.2 - Finding Probabilities for Normal Distributions In...Ch. 5.2 - Finding Probabilities for Normal Distributions In...Ch. 5.2 - Graphical Analysis In Exercises 1316, a member is...Ch. 5.2 - Graphical Analysis In Exercises 1316, a member is...Ch. 5.2 - Graphical Analysis In Exercises 1316, a member is...Ch. 5.2 - Graphical Analysis In Exercises 1316, a member is...Ch. 5.2 - Using Normal Distributions In Exercises 1720,...Ch. 5.2 - Using Normal Distributions In Exercises 1720,...Ch. 5.2 - Using Normal Distributions In Exercises 1720,...Ch. 5.2 - Using Normal Distributions In Exercises 1720,...Ch. 5.2 - In Exercises 2124, a control chart is shown. Each...Ch. 5.2 - In Exercises 2124, a control chart is shown. Each...Ch. 5.2 - In Exercises 2124, a control chart is shown. Each...Ch. 5.2 - In Exercises 2124, a control chart is shown. Each...Ch. 5.3 - 1. Find the z-score that has 96.16% of the...Ch. 5.3 - Find the z-score that corresponds to each...Ch. 5.3 - A veterinarian records the weights of dogs treated...Ch. 5.3 - A researcher tests the braking distances of...Ch. 5.3 - The lengths of time employees have worked at a...Ch. 5.3 - Finding a z-Score In Exercises 116, use the...Ch. 5.3 - Finding a z-Score In Exercises 116, use the...Ch. 5.3 - Prob. 3ECh. 5.3 - Finding a z-Score In Exercises 116, use the...Ch. 5.3 - Prob. 5ECh. 5.3 - Prob. 6ECh. 5.3 - Prob. 7ECh. 5.3 - Finding a z-Score In Exercises 116, use the...Ch. 5.3 - Prob. 9ECh. 5.3 - Finding a z-Score In Exercises 116, use the...Ch. 5.3 - Finding a z-Score In Exercises 116, use the...Ch. 5.3 - Finding a z-Score In Exercises 116, use the...Ch. 5.3 - Prob. 13ECh. 5.3 - Prob. 14ECh. 5.3 - Prob. 15ECh. 5.3 - Prob. 16ECh. 5.3 - Graphical Analysis In Exercises 1722, find the...Ch. 5.3 - Graphical Analysis In Exercises 1722, find the...Ch. 5.3 - Prob. 19ECh. 5.3 - Graphical Analysis In Exercises 1722, find the...Ch. 5.3 - Graphical Analysis In Exercises 1722, find the...Ch. 5.3 - Graphical Analysis In Exercises 1722, find the...Ch. 5.3 - Finding a z-Score Given an Area In Exercises 2330,...Ch. 5.3 - Finding a z-Score Given an Area In Exercises 2330,...Ch. 5.3 - Finding a z-Score Given an Area In Exercises 2330,...Ch. 5.3 - Finding a z-Score Given an Area In Exercises 2330,...Ch. 5.3 - Finding a z-Score Given an Area In Exercises 2330,...Ch. 5.3 - Finding a z-Score Given an Area In Exercises 2330,...Ch. 5.3 - Find the positive z-score for which 80% of the...Ch. 5.3 - Find the positive z-score for which 12% of the...Ch. 5.3 - Finding Specified Data Values In Exercises 3138,...Ch. 5.3 - Finding Specified Data Values In Exercises 3138,...Ch. 5.3 - Finding Specified Data Values In Exercises 3138,...Ch. 5.3 - Finding Specified Data Values In Exercises 3138,...Ch. 5.3 - Undergraduate Grade Point Average The...Ch. 5.3 - GRE Scores The test scores for the analytical...Ch. 5.3 - Finding Specified Data Values In Exercises 3138,...Ch. 5.3 - Finding Specified Data Values In Exercises 3138,...Ch. 5.3 - Bags of Baby Carrots The weights of bags of baby...Ch. 5.3 - Writing a Guarantee You sell a brand of automobile...Ch. 5.3 - Vending Machine A vending machine dispenses coffee...Ch. 5.3 - History Grades In a large section of a history...Ch. 5.3 - CASE STUDY Birth Weights in America The National...Ch. 5.3 - CASE STUDY Birth Weights in America The National...Ch. 5.3 - CASE STUDY Birth Weights in America The National...Ch. 5.3 - CASE STUDY Birth Weights in America The National...Ch. 5.3 - Prob. 5CSCh. 5.4 - List all possible samples of size n = 3. with...Ch. 5.4 - Random samples of size 64 are drawn from the...Ch. 5.4 - The diameters of fully grown white oak trees are...Ch. 5.4 - You randomly select 100 drivers ages 16 to 19 from...Ch. 5.4 - The average sales price of a single-family house...Ch. 5.4 - A consumer price analyst claims that prices for...Ch. 5.4 - In Exercises 14, a population has a mean and a...Ch. 5.4 - In Exercises 14, a population has a mean and a...Ch. 5.4 - In Exercises 14, a population has a mean and a...Ch. 5.4 - In Exercises 14, a population has a mean and a...Ch. 5.4 - True or False? In Exercises 58, determine whether...Ch. 5.4 - True or False? In Exercises 58, determine whether...Ch. 5.4 - True or False? In Exercises 58, determine whether...Ch. 5.4 - True or False? In Exercises 58, determine whether...Ch. 5.4 - Graphical Analysis In Exercises 9 and 10, the...Ch. 5.4 - Graphical Analysis In Exercises 9 and 10, the...Ch. 5.4 - A Sampling Distribution of Sample Means In...Ch. 5.4 - A Sampling Distribution of Sample Means In...Ch. 5.4 - A Sampling Distribution of Sample Means In...Ch. 5.4 - A Sampling Distribution of Sample Means In...Ch. 5.4 - Finding Probabilities In Exercises 1518, the...Ch. 5.4 - Finding Probabilities In Exercises 1518, the...Ch. 5.4 - Finding Probabilities In Exercises 1518, the...Ch. 5.4 - Finding Probabilities In Exercises 1518, the...Ch. 5.4 - Interpreting the Central Limit Theorem In...Ch. 5.4 - Interpreting the Central Limit Theorem In...Ch. 5.4 - Interpreting the Central Limit Theorem In...Ch. 5.4 - Interpreting the Central Limit Theorem In...Ch. 5.4 - Interpreting the Central Limit Theorem In...Ch. 5.4 - Interpreting the Central Limit Theorem In...Ch. 5.4 - Interpreting the Central Limit Theorem In...Ch. 5.4 - Interpreting the Central Limit Theorem In...Ch. 5.4 - Repeat Exercise 19 for samples of size 40 and 60....Ch. 5.4 - Repeat Exercise 20 for samples of size 72 and 108....Ch. 5.4 - Finding Probabilities for Sampling Distributions...Ch. 5.4 - Finding Probabilities for Sampling Distributions...Ch. 5.4 - Finding Probabilities for Sampling Distributions...Ch. 5.4 - Finding Probabilities for Sampling Distributions...Ch. 5.4 - Which Is More Likely? Assume that the childhood...Ch. 5.4 - Which Is More Likely? Assume that the carbon...Ch. 5.4 - Paint Cans A machine is set to fill paint cans...Ch. 5.4 - Milk Containers A machine is set to fill milk...Ch. 5.4 - Finding Probabilities for Sampling Distributions...Ch. 5.4 - Finding Probabilities for Sampling Distributions...Ch. 5.4 - In Exercises 39 and 40, determine whether the...Ch. 5.4 - In Exercises 39 and 40, determine whether the...Ch. 5.4 - Sampling Distribution of Sample Proportions For a...Ch. 5.4 - Sampling Distribution of Sample Proportions For a...Ch. 5.4 - Run the simulation using n = 30 and N = 10 for a...Ch. 5.4 - Run the simulation using n = 50 and N = 10 for a...Ch. 5.5 - A binomial experiment is listed. Determine whether...Ch. 5.5 - Use a continuity correction to convert each...Ch. 5.5 - In a survey of adults in the United States, 29%...Ch. 5.5 - In Example 4, what is the probability that at most...Ch. 5.5 - The study in Example 5 found that 32.0% of all men...Ch. 5.5 - In Exercises 14, the sample size n,. probability...Ch. 5.5 - In Exercises 14, the sample size n,. probability...Ch. 5.5 - Prob. 3ECh. 5.5 - Prob. 4ECh. 5.5 - In Exercises 5-8, match the binomial probability...Ch. 5.5 - In Exercises 5-8, match the binomial probability...Ch. 5.5 - In Exercises 5-8, match the binomial probability...Ch. 5.5 - In Exercises 5-8, match the binomial probability...Ch. 5.5 - In Exercises 9-14, write the binomial probability...Ch. 5.5 - In Exercises 9-14, write the binomial probability...Ch. 5.5 - In Exercises 9-14, write the binomial probability...Ch. 5.5 - In Exercises 9-14, write the binomial probability...Ch. 5.5 - In Exercises 9-14, write the binomial probability...Ch. 5.5 - In Exercises 9-14, write the binomial probability...Ch. 5.5 - Graphical Analysis In Exercises 15 and 16, write...Ch. 5.5 - Graphical Analysis In Exercises 15 and 16, write...Ch. 5.5 - Approximating a Binomial Distribution In Exercises...Ch. 5.5 - Approximating a Binomial Distribution In Exercises...Ch. 5.5 - Approximating Binomial Probabilities In Exercises...Ch. 5.5 - Approximating Binomial Probabilities In Exercises...Ch. 5.5 - Approximating Binomial Probabilities In Exercises...Ch. 5.5 - Approximating Binomial Probabilities In Exercises...Ch. 5.5 - Approximating Binomial Probabilities In Exercises...Ch. 5.5 - Approximating Binomial Probabilities In Exercises...Ch. 5.5 - Approximating Binomial Probabilities In Exercises...Ch. 5.5 - Approximating Binomial Probabilities In Exercises...Ch. 5.5 - Minimum Wage About 3.3% of hourly paid U.S....Ch. 5.5 - Education A survey of U.S. adults found that 8%...Ch. 5.5 - Getting Physical The figure shows the results of a...Ch. 5.5 - Getting Physical The figure shows the results of a...Ch. 5.5 - Testing a Drug A drug manufacturer claims that a...Ch. 5.5 - Testing a Drug A drug manufacturer claims that a...Ch. 5 - Is It Unusual? A population is normally...Ch. 5 - Find the Error The mean age of students at a high...Ch. 5 - Give an example of a distribution that might be...Ch. 5 - In Exercises I and 2, use the normal curve to...Ch. 5 - In Exercises I and 2, use the normal curve to...Ch. 5 - In Exercises 3 and 4, use the normal curves shown...Ch. 5 - Prob. 5.1.4RECh. 5 - In Exercises 5 and 6, find the area of the...Ch. 5 - In Exercises 5 and 6, find the area of the...Ch. 5 - In Exercises 7-18, find the indicated area under...Ch. 5 - In Exercises 7-18, find the indicated area under...Ch. 5 - In Exercises 7-18, find the indicated area under...Ch. 5 - In Exercises 7-18, find the indicated area under...Ch. 5 - In Exercises 7-18, find the indicated area under...Ch. 5 - In Exercises 7-18, find the indicated area under...Ch. 5 - In Exercises 7-18, find the indicated area under...Ch. 5 - In Exercises 7-18, find the indicated area under...Ch. 5 - In Exercises 7-18, find the indicated area under...Ch. 5 - In Exercises 7-18, find the indicated area under...Ch. 5 - In Exercises 7-18, find the indicated area under...Ch. 5 - In Exercises 7-18, find the indicated area under...Ch. 5 - The scores for the reading portion of the ACT test...Ch. 5 - The scores for the reading portion of the ACT test...Ch. 5 - In Exercises 21-26, find the indicated probability...Ch. 5 - In Exercises 21-26, find the indicated probability...Ch. 5 - In Exercises 21-26, find the indicated probability...Ch. 5 - In Exercises 21-26, find the indicated probability...Ch. 5 - In Exercises 21-26, find the indicated probability...Ch. 5 - In Exercises 21-26, find the indicated probability...Ch. 5 - In Exercises 2732, the random variable x is...Ch. 5 - In Exercises 2732, the random variable x is...Ch. 5 - In Exercises 2732, the random variable x is...Ch. 5 - In Exercises 2732, the random variable x is...Ch. 5 - In Exercises 2732, the random variable x is...Ch. 5 - In Exercises 2732, the random variable x is...Ch. 5 - In Exercises 33 and 34, find the indicated...Ch. 5 - In Exercises 33 and 34, find the indicated...Ch. 5 - Determine whether any of the events in Exercise 33...Ch. 5 - Determine whether any of the events in Exercise 34...Ch. 5 - In Exercises 3742, use the Standard Normal Table...Ch. 5 - In Exercises 3742, use the Standard Normal Table...Ch. 5 - In Exercises 3742, use the Standard Normal Table...Ch. 5 - In Exercises 3742, use the Standard Normal Table...Ch. 5 - In Exercises 3742, use the Standard Normal Table...Ch. 5 - In Exercises 3742, use the Standard Normal Table...Ch. 5 - In Exercises 3742, use the Standard Normal Table...Ch. 5 - In Exercises 3742, use the Standard Normal Table...Ch. 5 - On a dry surface, the braking distances (in feet),...Ch. 5 - On a dry surface, the braking distances (in feet),...Ch. 5 - Prob. 5.3.47RECh. 5 - On a dry surface, the braking distances (in feet),...Ch. 5 - On a dry surface, the braking distances (in feet),...Ch. 5 - Prob. 5.3.50RECh. 5 - In Exercises 51 and 52, a population and sample...Ch. 5 - In Exercises 51 and 52, a population and sample...Ch. 5 - Prob. 5.4.53RECh. 5 - Prob. 5.4.54RECh. 5 - In Exercises 5560, find the indicated...Ch. 5 - In Exercises 5560, find the indicated...Ch. 5 - In Exercises 5560, find the indicated...Ch. 5 - In Exercises 5560, find the indicated...Ch. 5 - Prob. 5.4.59RECh. 5 - Prob. 5.4.60RECh. 5 - Prob. 5.5.61RECh. 5 - Prob. 5.5.62RECh. 5 - In Exercises 63-68, write the binomial probability...Ch. 5 - In Exercises 63-68, write the binomial probability...Ch. 5 - In Exercises 63-68, write the binomial probability...Ch. 5 - In Exercises 63-68, write the binomial probability...Ch. 5 - In Exercises 63-68, write the binomial probability...Ch. 5 - Prob. 5.5.68RECh. 5 - In Exercises 69 and 70, determine whether you can...Ch. 5 - In Exercises 69 and 70, determine whether you can...Ch. 5 - Find each probability using the standard normal...Ch. 5 - The random variable x is normally distributed with...Ch. 5 - In a standardized IQ test, scores are normally...Ch. 5 - In a standardized IQ test, scores are normally...Ch. 5 - In a standardized IQ test, scores are normally...Ch. 5 - In a standardized IQ test, scores are normally...Ch. 5 - In a standardized IQ test, scores are normally...Ch. 5 - In a standardized IQ test, scores are normally...Ch. 5 - In a standardized IQ test, scores are normally...Ch. 5 - Are you more likely to randomly select one person...Ch. 5 - In a survey of U.S. adults, 16% say they have had...Ch. 5 - In a survey of U.S. adults, 16% say they have had...Ch. 5 - Prob. 1CTCh. 5 - In Exercises 2-4, the random variable x is...Ch. 5 - In Exercises 2-4, the random variable x is...Ch. 5 - In Exercises 2-4, the random variable x is...Ch. 5 - In Exercises 5 and 6. determine whether you can...Ch. 5 - In Exercises 5 and 6. determine whether you can...Ch. 5 - The per capita disposable income for residents of...Ch. 5 - The per capita disposable income for residents of...Ch. 5 - The per capita disposable income for residents of...Ch. 5 - The per capita disposable income for residents of...Ch. 5 - EXERCISES 1. Sampling Individuals Assume the...Ch. 5 - Sampling Groups of Five Assume the machine shifts...Ch. 5 - Writing an Explanation Write a paragraph to your...Ch. 5 - A survey of adults in the United States found that...Ch. 5 - Prob. 2CRCh. 5 - In Exercises 2 and 3, find the (a) mean, (b)...Ch. 5 - Use the probability distribution in Exercise 3 to...Ch. 5 - From a pool of 16 candidates, 9 men and 7 women,...Ch. 5 - In Exercises 6-11, find the indicated area under...Ch. 5 - In Exercises 6-11, find the indicated area under...Ch. 5 - In Exercises 6-11, find the indicated area under...Ch. 5 - In Exercises 6-11, find the indicated area under...Ch. 5 - Prob. 10CRCh. 5 - In Exercises 6-11, find the indicated area under...Ch. 5 - Twenty-eight percent of U.S. adults think that...Ch. 5 - Prob. 13CRCh. 5 - Prob. 14CRCh. 5 - A survey of adults in the United States found that...Ch. 5 - The life spans of car batteries are normally...Ch. 5 - A florist has 12 different flowers from which...Ch. 5 - Seventy percent of U.S. adults anticipate major...
Knowledge Booster


Learn more about
Need a deep-dive on the concept behind this application? Look no further. Learn more about this topic, statistics and related others by exploring similar questions and additional content below.Similar questions
- Exercise 6-6 (Algo) (LO6-3) The director of admissions at Kinzua University in Nova Scotia estimated the distribution of student admissions for the fall semester on the basis of past experience. Admissions Probability 1,100 0.5 1,400 0.4 1,300 0.1 Click here for the Excel Data File Required: What is the expected number of admissions for the fall semester? Compute the variance and the standard deviation of the number of admissions. Note: Round your standard deviation to 2 decimal places.arrow_forward1. Find the mean of the x-values (x-bar) and the mean of the y-values (y-bar) and write/label each here: 2. Label the second row in the table using proper notation; then, complete the table. In the fifth and sixth columns, show the 'products' of what you're multiplying, as well as the answers. X y x minus x-bar y minus y-bar (x minus x-bar)(y minus y-bar) (x minus x-bar)^2 xy 16 20 34 4-2 5 2 3. Write the sums that represents Sxx and Sxy in the table, at the bottom of their respective columns. 4. Find the slope of the Regression line: bi = (simplify your answer) 5. Find the y-intercept of the Regression line, and then write the equation of the Regression line. Show your work. Then, BOX your final answer. Express your line as "y-hat equals...arrow_forwardApply STATA commands & submit the output for each question only when indicated below i. Generate the log of birthweight and family income of children. Name these new variables Ibwght & Ifaminc. Include the output of this code. ii. Apply the command sum with the detail option to the variable faminc. Note: you should find the 25th percentile value, the 50th percentile and the 75th percentile value of faminc from the output - you will need it to answer the next question Include the output of this code. iii. iv. Use the output from part ii of this question to Generate a variable called "high_faminc" that takes a value 1 if faminc is less than or equal to the 25th percentile, it takes the value 2 if faminc is greater than 25th percentile but less than or equal to the 50th percentile, it takes the value 3 if faminc is greater than 50th percentile but less than or equal to the 75th percentile, it takes the value 4 if faminc is greater than the 75th percentile. Include the outcome of this code…arrow_forward
- solve this on paperarrow_forwardApply STATA commands & submit the output for each question only when indicated below i. Apply the command egen to create a variable called "wyd" which is the rowtotal function on variables bwght & faminc. ii. Apply the list command for the first 10 observations to show that the code in part i worked. Include the outcome of this code iii. Apply the egen command to create a new variable called "bwghtsum" using the sum function on variable bwght by the variable high_faminc (Note: need to apply the bysort' statement) iv. Apply the "by high_faminc" statement to find the V. descriptive statistics of bwght and bwghtsum Include the output of this code. Why is there a difference between the standard deviations of bwght and bwghtsum from part iv of this question?arrow_forwardAccording to a health information website, the distribution of adults’ diastolic blood pressure (in millimeters of mercury, mmHg) can be modeled by a normal distribution with mean 70 mmHg and standard deviation 20 mmHg. b. Above what diastolic pressure would classify someone in the highest 1% of blood pressures? Show all calculations used.arrow_forward
- Write STATA codes which will generate the outcomes in the questions & submit the output for each question only when indicated below i. ii. iii. iv. V. Write a code which will allow STATA to go to your favorite folder to access your files. Load the birthweight1.dta dataset from your favorite folder and save it under a different filename to protect data integrity. Call the new dataset babywt.dta (make sure to use the replace option). Verify that it contains 2,998 observations and 8 variables. Include the output of this code. Are there missing observations for variable(s) for the variables called bwght, faminc, cigs? How would you know? (You may use more than one code to show your answer(s)) Include the output of your code (s). Write the definitions of these variables: bwght, faminc, male, white, motheduc,cigs; which of these variables are categorical? [Hint: use the labels of the variables & the browse command] Who is this dataset about? Who can use this dataset to answer what kind of…arrow_forwardApply STATA commands & submit the output for each question only when indicated below İ. ii. iii. iv. V. Apply the command summarize on variables bwght and faminc. What is the average birthweight of babies and family income of the respondents? Include the output of this code. Apply the tab command on the variable called male. How many of the babies and what share of babies are male? Include the output of this code. Find the summary statistics (i.e. use the sum command) of the variables bwght and faminc if the babies are white. Include the output of this code. Find the summary statistics (i.e. use the sum command) of the variables bwght and faminc if the babies are male but not white. Include the output of this code. Using your answers to previous subparts of this question: What is the difference between the average birthweight of a baby who is male and a baby who is male but not white? What can you say anything about the difference in family income of the babies that are male and male…arrow_forwardA public health researcher is studying the impacts of nudge marketing techniques on shoppers vegetablesarrow_forward
- The director of admissions at Kinzua University in Nova Scotia estimated the distribution of student admissions for the fall semester on the basis of past experience. Admissions Probability 1,100 0.5 1,400 0.4 1,300 0.1 Click here for the Excel Data File Required: What is the expected number of admissions for the fall semester? Compute the variance and the standard deviation of the number of admissions. Note: Round your standard deviation to 2 decimal places.arrow_forwardA pollster randomly selected four of 10 available people. Required: How many different groups of 4 are possible? What is the probability that a person is a member of a group? Note: Round your answer to 3 decimal places.arrow_forwardWind Mountain is an archaeological study area located in southwestern New Mexico. Potsherds are broken pieces of prehistoric Native American clay vessels. One type of painted ceramic vessel is called Mimbres classic black-on-white. At three different sites the number of such sherds was counted in local dwelling excavations. Test given. Site I Site II Site III 63 19 60 43 34 21 23 49 51 48 11 15 16 46 26 20 31 Find .arrow_forward
arrow_back_ios
SEE MORE QUESTIONS
arrow_forward_ios
Recommended textbooks for you
 Big Ideas Math A Bridge To Success Algebra 1: Stu...AlgebraISBN:9781680331141Author:HOUGHTON MIFFLIN HARCOURTPublisher:Houghton Mifflin Harcourt
 Glencoe Algebra 1, Student Edition, 9780079039897...AlgebraISBN:9780079039897Author:CarterPublisher:McGraw Hill
 Trigonometry (MindTap Course List)TrigonometryISBN:9781305652224Author:Charles P. McKeague, Mark D. TurnerPublisher:Cengage Learning
 Trigonometry (MindTap Course List)TrigonometryISBN:9781337278461Author:Ron LarsonPublisher:Cengage Learning
Big Ideas Math A Bridge To Success Algebra 1: Stu...
Algebra
ISBN:9781680331141
Author:HOUGHTON MIFFLIN HARCOURT
Publisher:Houghton Mifflin Harcourt
Glencoe Algebra 1, Student Edition, 9780079039897...
Algebra
ISBN:9780079039897
Author:Carter
Publisher:McGraw Hill
Trigonometry (MindTap Course List)
Trigonometry
ISBN:9781305652224
Author:Charles P. McKeague, Mark D. Turner
Publisher:Cengage Learning
Trigonometry (MindTap Course List)
Trigonometry
ISBN:9781337278461
Author:Ron Larson
Publisher:Cengage Learning
Which is the best chart: Selecting among 14 types of charts Part II; Author: 365 Data Science;https://www.youtube.com/watch?v=qGaIB-bRn-A;License: Standard YouTube License, CC-BY