
Elementary Statistics: Picturing the World (7th Edition)
7th Edition
ISBN: 9780134683416
Author: Ron Larson, Betsy Farber
Publisher: PEARSON
expand_more
expand_more
format_list_bulleted
Concept explainers
Videos
Textbook Question
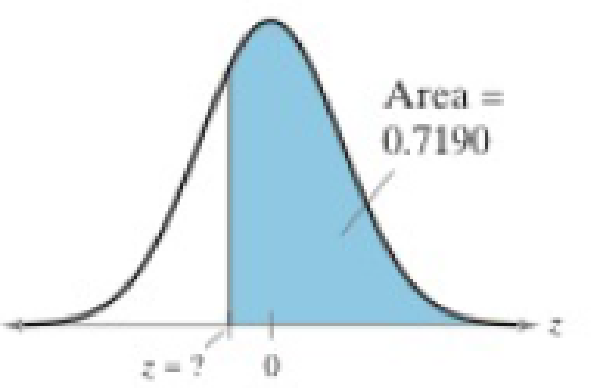
Chapter 5.3, Problem 20E
Graphical Analysis In Exercises 17–22, find the indicated z-score(s) shown in the graph.
20. 
Expert Solution & Answer
Want to see the full answer?
Check out a sample textbook solution
Students have asked these similar questions
There are four white, fourteen blue and five green marbles in a bag. A marble is selected from the bag without looking. Find the odds of the following:
The odds against selecting a green marble.
The odds in favour of not selecting a green marble
The odds in favor of the marble selected being either a white or a blue marble.
What is true about the above odds? Explain
Please show as much work as possible to clearly show the steps you used to find each solution. If you plan to use a calculator, please be sure to clearly indicate your strategy.
1. The probability of a soccer game in a particular league going into overtime is 0.125. Find the following:
a. The odds in favour of a game going into overtime.
b. The odds in favour of a game not going into overtime.
c. If the teams in the league play 100 games in a season, about how many games would you expect to go into overtime?
explain the importance of the Hypothesis test in a business setting, and give an example of a situation where it is helpful in business decision making.
Chapter 5 Solutions
Elementary Statistics: Picturing the World (7th Edition)
Ch. 5.1 - 1. Which normal curve has the greatest mean? 2....Ch. 5.1 - The scaled test scores for the New York State...Ch. 5.1 - A U.S. adult who is at least 20 years old is...Ch. 5.1 - Find the area under the standard normal curve to...Ch. 5.1 - Find the area under the standard normal curve to...Ch. 5.1 - Find the area under the standard normal curve...Ch. 5.1 - Find three real-life examples of a continuous...Ch. 5.1 - In a normal distribution, which is greater, the...Ch. 5.1 - What is the total area under the normal curve?Ch. 5.1 - What do the inflection points on a normal...
Ch. 5.1 - Draw two normal curves that have the same mean but...Ch. 5.1 - Draw two normal curves that have different means...Ch. 5.1 - What is the mean of the standard normal...Ch. 5.1 - Describe how you can transform a nonstandard...Ch. 5.1 - Getting at the Concept Why is it correct to say a...Ch. 5.1 - Getting at the Concept A z-score is 0. Which of...Ch. 5.1 - Graphical Analysis In Exercises 1116, determine...Ch. 5.1 - Graphical Analysis In Exercises 1116, determine...Ch. 5.1 - Graphical Analysis In Exercises 1116, determine...Ch. 5.1 - Graphical Analysis In Exercises 1116, determine...Ch. 5.1 - Graphical Analysis In Exercises 1116, determine...Ch. 5.1 - Graphical Analysis In Exercises 1116, determine...Ch. 5.1 - Finding Area In Exercises 1722, find the area of...Ch. 5.1 - Finding Area In Exercises 1722, find the area of...Ch. 5.1 - Finding Area In Exercises 1722, find the area of...Ch. 5.1 - Finding Area In Exercises 1722, find the area of...Ch. 5.1 - Finding Area In Exercises 1722, find the area of...Ch. 5.1 - Finding Area In Exercises 1722, find the area of...Ch. 5.1 - Finding Area In Exercises 2336, find the indicated...Ch. 5.1 - Finding Area In Exercises 2336, find the indicated...Ch. 5.1 - Finding Area In Exercises 2336, find the indicated...Ch. 5.1 - Finding Area In Exercises 2336, find the indicated...Ch. 5.1 - Finding Area In Exercises 2336, find the indicated...Ch. 5.1 - Finding Area In Exercises 2336, find the indicated...Ch. 5.1 - Finding Area In Exercises 2336, find the indicated...Ch. 5.1 - Finding Area In Exercises 2336, find the indicated...Ch. 5.1 - Finding Area In Exercises 2336, find the indicated...Ch. 5.1 - Finding Area In Exercises 2336, find the indicated...Ch. 5.1 - Finding Area In Exercises 2336, find the indicated...Ch. 5.1 - Finding Area In Exercises 2336, find the indicated...Ch. 5.1 - Finding Area In Exercises 2336, find the indicated...Ch. 5.1 - Finding Area In Exercises 2336, find the indicated...Ch. 5.1 - Manufacturer Claims You work for a consumer...Ch. 5.1 - Milk Consumption You are performing a study about...Ch. 5.1 - Computing and Interpreting z-Scores In Exercises...Ch. 5.1 - Computing and Interpreting z-Scores In Exercises...Ch. 5.1 - Finding Probability In Exercises 4146, find the...Ch. 5.1 - Finding Probability In Exercises 4146, find the...Ch. 5.1 - Finding Probability In Exercises 4146, find the...Ch. 5.1 - Finding Probability In Exercises 4146, find the...Ch. 5.1 - Finding Probability In Exercises 4146, find the...Ch. 5.1 - Finding Probability In Exercises 4146, find the...Ch. 5.1 - Finding Probability In Exercises 4756, find the...Ch. 5.1 - Finding Probability In Exercises 4756, find the...Ch. 5.1 - Finding Probability In Exercises 4756, find the...Ch. 5.1 - Finding Probability In Exercises 4756, find the...Ch. 5.1 - Finding Probability In Exercises 4756, find the...Ch. 5.1 - Finding Probability In Exercises 4756, find the...Ch. 5.1 - Finding Probability In Exercises 4756, find the...Ch. 5.1 - Finding Probability In Exercises 4756, find the...Ch. 5.1 - Finding Probability In Exercises 4756, find the...Ch. 5.1 - Finding Probability In Exercises 4756, find the...Ch. 5.1 - Writing Draw a normal curve with a mean of 60 and...Ch. 5.1 - Writing Draw a normal curve with a mean of 450 and...Ch. 5.1 - Prob. 59ECh. 5.1 - Uniform Distribution A uniform distribution is a...Ch. 5.2 - The average speed of vehicles traveling on a...Ch. 5.2 - What is the probability that the shopper in...Ch. 5.2 - Find the cumulative area that corresponds to a...Ch. 5.2 - Computing Probabilities for Normal Distributions...Ch. 5.2 - Computing Probabilities for Normal Distributions...Ch. 5.2 - Computing Probabilities for Normal Distributions...Ch. 5.2 - Computing Probabilities for Normal Distributions...Ch. 5.2 - Computing Probabilities for Normal Distributions...Ch. 5.2 - Computing Probabilities for Normal Distributions...Ch. 5.2 - Finding Probabilities for Normal Distributions In...Ch. 5.2 - Finding Probabilities for Normal Distributions In...Ch. 5.2 - Finding Probabilities for Normal Distributions In...Ch. 5.2 - Finding Probabilities for Normal Distributions In...Ch. 5.2 - Finding Probabilities for Normal Distributions In...Ch. 5.2 - Finding Probabilities for Normal Distributions In...Ch. 5.2 - Graphical Analysis In Exercises 1316, a member is...Ch. 5.2 - Graphical Analysis In Exercises 1316, a member is...Ch. 5.2 - Graphical Analysis In Exercises 1316, a member is...Ch. 5.2 - Graphical Analysis In Exercises 1316, a member is...Ch. 5.2 - Using Normal Distributions In Exercises 1720,...Ch. 5.2 - Using Normal Distributions In Exercises 1720,...Ch. 5.2 - Using Normal Distributions In Exercises 1720,...Ch. 5.2 - Using Normal Distributions In Exercises 1720,...Ch. 5.2 - In Exercises 2124, a control chart is shown. Each...Ch. 5.2 - In Exercises 2124, a control chart is shown. Each...Ch. 5.2 - In Exercises 2124, a control chart is shown. Each...Ch. 5.2 - In Exercises 2124, a control chart is shown. Each...Ch. 5.3 - 1. Find the z-score that has 96.16% of the...Ch. 5.3 - Find the z-score that corresponds to each...Ch. 5.3 - A veterinarian records the weights of dogs treated...Ch. 5.3 - A researcher tests the braking distances of...Ch. 5.3 - The lengths of time employees have worked at a...Ch. 5.3 - Finding a z-Score In Exercises 116, use the...Ch. 5.3 - Finding a z-Score In Exercises 116, use the...Ch. 5.3 - Prob. 3ECh. 5.3 - Finding a z-Score In Exercises 116, use the...Ch. 5.3 - Prob. 5ECh. 5.3 - Prob. 6ECh. 5.3 - Prob. 7ECh. 5.3 - Finding a z-Score In Exercises 116, use the...Ch. 5.3 - Prob. 9ECh. 5.3 - Finding a z-Score In Exercises 116, use the...Ch. 5.3 - Finding a z-Score In Exercises 116, use the...Ch. 5.3 - Finding a z-Score In Exercises 116, use the...Ch. 5.3 - Prob. 13ECh. 5.3 - Prob. 14ECh. 5.3 - Prob. 15ECh. 5.3 - Prob. 16ECh. 5.3 - Graphical Analysis In Exercises 1722, find the...Ch. 5.3 - Graphical Analysis In Exercises 1722, find the...Ch. 5.3 - Prob. 19ECh. 5.3 - Graphical Analysis In Exercises 1722, find the...Ch. 5.3 - Graphical Analysis In Exercises 1722, find the...Ch. 5.3 - Graphical Analysis In Exercises 1722, find the...Ch. 5.3 - Finding a z-Score Given an Area In Exercises 2330,...Ch. 5.3 - Finding a z-Score Given an Area In Exercises 2330,...Ch. 5.3 - Finding a z-Score Given an Area In Exercises 2330,...Ch. 5.3 - Finding a z-Score Given an Area In Exercises 2330,...Ch. 5.3 - Finding a z-Score Given an Area In Exercises 2330,...Ch. 5.3 - Finding a z-Score Given an Area In Exercises 2330,...Ch. 5.3 - Find the positive z-score for which 80% of the...Ch. 5.3 - Find the positive z-score for which 12% of the...Ch. 5.3 - Finding Specified Data Values In Exercises 3138,...Ch. 5.3 - Finding Specified Data Values In Exercises 3138,...Ch. 5.3 - Finding Specified Data Values In Exercises 3138,...Ch. 5.3 - Finding Specified Data Values In Exercises 3138,...Ch. 5.3 - Undergraduate Grade Point Average The...Ch. 5.3 - GRE Scores The test scores for the analytical...Ch. 5.3 - Finding Specified Data Values In Exercises 3138,...Ch. 5.3 - Finding Specified Data Values In Exercises 3138,...Ch. 5.3 - Bags of Baby Carrots The weights of bags of baby...Ch. 5.3 - Writing a Guarantee You sell a brand of automobile...Ch. 5.3 - Vending Machine A vending machine dispenses coffee...Ch. 5.3 - History Grades In a large section of a history...Ch. 5.3 - CASE STUDY Birth Weights in America The National...Ch. 5.3 - CASE STUDY Birth Weights in America The National...Ch. 5.3 - CASE STUDY Birth Weights in America The National...Ch. 5.3 - CASE STUDY Birth Weights in America The National...Ch. 5.3 - Prob. 5CSCh. 5.4 - List all possible samples of size n = 3. with...Ch. 5.4 - Random samples of size 64 are drawn from the...Ch. 5.4 - The diameters of fully grown white oak trees are...Ch. 5.4 - You randomly select 100 drivers ages 16 to 19 from...Ch. 5.4 - The average sales price of a single-family house...Ch. 5.4 - A consumer price analyst claims that prices for...Ch. 5.4 - In Exercises 14, a population has a mean and a...Ch. 5.4 - In Exercises 14, a population has a mean and a...Ch. 5.4 - In Exercises 14, a population has a mean and a...Ch. 5.4 - In Exercises 14, a population has a mean and a...Ch. 5.4 - True or False? In Exercises 58, determine whether...Ch. 5.4 - True or False? In Exercises 58, determine whether...Ch. 5.4 - True or False? In Exercises 58, determine whether...Ch. 5.4 - True or False? In Exercises 58, determine whether...Ch. 5.4 - Graphical Analysis In Exercises 9 and 10, the...Ch. 5.4 - Graphical Analysis In Exercises 9 and 10, the...Ch. 5.4 - A Sampling Distribution of Sample Means In...Ch. 5.4 - A Sampling Distribution of Sample Means In...Ch. 5.4 - A Sampling Distribution of Sample Means In...Ch. 5.4 - A Sampling Distribution of Sample Means In...Ch. 5.4 - Finding Probabilities In Exercises 1518, the...Ch. 5.4 - Finding Probabilities In Exercises 1518, the...Ch. 5.4 - Finding Probabilities In Exercises 1518, the...Ch. 5.4 - Finding Probabilities In Exercises 1518, the...Ch. 5.4 - Interpreting the Central Limit Theorem In...Ch. 5.4 - Interpreting the Central Limit Theorem In...Ch. 5.4 - Interpreting the Central Limit Theorem In...Ch. 5.4 - Interpreting the Central Limit Theorem In...Ch. 5.4 - Interpreting the Central Limit Theorem In...Ch. 5.4 - Interpreting the Central Limit Theorem In...Ch. 5.4 - Interpreting the Central Limit Theorem In...Ch. 5.4 - Interpreting the Central Limit Theorem In...Ch. 5.4 - Repeat Exercise 19 for samples of size 40 and 60....Ch. 5.4 - Repeat Exercise 20 for samples of size 72 and 108....Ch. 5.4 - Finding Probabilities for Sampling Distributions...Ch. 5.4 - Finding Probabilities for Sampling Distributions...Ch. 5.4 - Finding Probabilities for Sampling Distributions...Ch. 5.4 - Finding Probabilities for Sampling Distributions...Ch. 5.4 - Which Is More Likely? Assume that the childhood...Ch. 5.4 - Which Is More Likely? Assume that the carbon...Ch. 5.4 - Paint Cans A machine is set to fill paint cans...Ch. 5.4 - Milk Containers A machine is set to fill milk...Ch. 5.4 - Finding Probabilities for Sampling Distributions...Ch. 5.4 - Finding Probabilities for Sampling Distributions...Ch. 5.4 - In Exercises 39 and 40, determine whether the...Ch. 5.4 - In Exercises 39 and 40, determine whether the...Ch. 5.4 - Sampling Distribution of Sample Proportions For a...Ch. 5.4 - Sampling Distribution of Sample Proportions For a...Ch. 5.4 - Run the simulation using n = 30 and N = 10 for a...Ch. 5.4 - Run the simulation using n = 50 and N = 10 for a...Ch. 5.5 - A binomial experiment is listed. Determine whether...Ch. 5.5 - Use a continuity correction to convert each...Ch. 5.5 - In a survey of adults in the United States, 29%...Ch. 5.5 - In Example 4, what is the probability that at most...Ch. 5.5 - The study in Example 5 found that 32.0% of all men...Ch. 5.5 - In Exercises 14, the sample size n,. probability...Ch. 5.5 - In Exercises 14, the sample size n,. probability...Ch. 5.5 - Prob. 3ECh. 5.5 - Prob. 4ECh. 5.5 - In Exercises 5-8, match the binomial probability...Ch. 5.5 - In Exercises 5-8, match the binomial probability...Ch. 5.5 - In Exercises 5-8, match the binomial probability...Ch. 5.5 - In Exercises 5-8, match the binomial probability...Ch. 5.5 - In Exercises 9-14, write the binomial probability...Ch. 5.5 - In Exercises 9-14, write the binomial probability...Ch. 5.5 - In Exercises 9-14, write the binomial probability...Ch. 5.5 - In Exercises 9-14, write the binomial probability...Ch. 5.5 - In Exercises 9-14, write the binomial probability...Ch. 5.5 - In Exercises 9-14, write the binomial probability...Ch. 5.5 - Graphical Analysis In Exercises 15 and 16, write...Ch. 5.5 - Graphical Analysis In Exercises 15 and 16, write...Ch. 5.5 - Approximating a Binomial Distribution In Exercises...Ch. 5.5 - Approximating a Binomial Distribution In Exercises...Ch. 5.5 - Approximating Binomial Probabilities In Exercises...Ch. 5.5 - Approximating Binomial Probabilities In Exercises...Ch. 5.5 - Approximating Binomial Probabilities In Exercises...Ch. 5.5 - Approximating Binomial Probabilities In Exercises...Ch. 5.5 - Approximating Binomial Probabilities In Exercises...Ch. 5.5 - Approximating Binomial Probabilities In Exercises...Ch. 5.5 - Approximating Binomial Probabilities In Exercises...Ch. 5.5 - Approximating Binomial Probabilities In Exercises...Ch. 5.5 - Minimum Wage About 3.3% of hourly paid U.S....Ch. 5.5 - Education A survey of U.S. adults found that 8%...Ch. 5.5 - Getting Physical The figure shows the results of a...Ch. 5.5 - Getting Physical The figure shows the results of a...Ch. 5.5 - Testing a Drug A drug manufacturer claims that a...Ch. 5.5 - Testing a Drug A drug manufacturer claims that a...Ch. 5 - Is It Unusual? A population is normally...Ch. 5 - Find the Error The mean age of students at a high...Ch. 5 - Give an example of a distribution that might be...Ch. 5 - In Exercises I and 2, use the normal curve to...Ch. 5 - In Exercises I and 2, use the normal curve to...Ch. 5 - In Exercises 3 and 4, use the normal curves shown...Ch. 5 - Prob. 5.1.4RECh. 5 - In Exercises 5 and 6, find the area of the...Ch. 5 - In Exercises 5 and 6, find the area of the...Ch. 5 - In Exercises 7-18, find the indicated area under...Ch. 5 - In Exercises 7-18, find the indicated area under...Ch. 5 - In Exercises 7-18, find the indicated area under...Ch. 5 - In Exercises 7-18, find the indicated area under...Ch. 5 - In Exercises 7-18, find the indicated area under...Ch. 5 - In Exercises 7-18, find the indicated area under...Ch. 5 - In Exercises 7-18, find the indicated area under...Ch. 5 - In Exercises 7-18, find the indicated area under...Ch. 5 - In Exercises 7-18, find the indicated area under...Ch. 5 - In Exercises 7-18, find the indicated area under...Ch. 5 - In Exercises 7-18, find the indicated area under...Ch. 5 - In Exercises 7-18, find the indicated area under...Ch. 5 - The scores for the reading portion of the ACT test...Ch. 5 - The scores for the reading portion of the ACT test...Ch. 5 - In Exercises 21-26, find the indicated probability...Ch. 5 - In Exercises 21-26, find the indicated probability...Ch. 5 - In Exercises 21-26, find the indicated probability...Ch. 5 - In Exercises 21-26, find the indicated probability...Ch. 5 - In Exercises 21-26, find the indicated probability...Ch. 5 - In Exercises 21-26, find the indicated probability...Ch. 5 - In Exercises 2732, the random variable x is...Ch. 5 - In Exercises 2732, the random variable x is...Ch. 5 - In Exercises 2732, the random variable x is...Ch. 5 - In Exercises 2732, the random variable x is...Ch. 5 - In Exercises 2732, the random variable x is...Ch. 5 - In Exercises 2732, the random variable x is...Ch. 5 - In Exercises 33 and 34, find the indicated...Ch. 5 - In Exercises 33 and 34, find the indicated...Ch. 5 - Determine whether any of the events in Exercise 33...Ch. 5 - Determine whether any of the events in Exercise 34...Ch. 5 - In Exercises 3742, use the Standard Normal Table...Ch. 5 - In Exercises 3742, use the Standard Normal Table...Ch. 5 - In Exercises 3742, use the Standard Normal Table...Ch. 5 - In Exercises 3742, use the Standard Normal Table...Ch. 5 - In Exercises 3742, use the Standard Normal Table...Ch. 5 - In Exercises 3742, use the Standard Normal Table...Ch. 5 - In Exercises 3742, use the Standard Normal Table...Ch. 5 - In Exercises 3742, use the Standard Normal Table...Ch. 5 - On a dry surface, the braking distances (in feet),...Ch. 5 - On a dry surface, the braking distances (in feet),...Ch. 5 - Prob. 5.3.47RECh. 5 - On a dry surface, the braking distances (in feet),...Ch. 5 - On a dry surface, the braking distances (in feet),...Ch. 5 - Prob. 5.3.50RECh. 5 - In Exercises 51 and 52, a population and sample...Ch. 5 - In Exercises 51 and 52, a population and sample...Ch. 5 - Prob. 5.4.53RECh. 5 - Prob. 5.4.54RECh. 5 - In Exercises 5560, find the indicated...Ch. 5 - In Exercises 5560, find the indicated...Ch. 5 - In Exercises 5560, find the indicated...Ch. 5 - In Exercises 5560, find the indicated...Ch. 5 - Prob. 5.4.59RECh. 5 - Prob. 5.4.60RECh. 5 - Prob. 5.5.61RECh. 5 - Prob. 5.5.62RECh. 5 - In Exercises 63-68, write the binomial probability...Ch. 5 - In Exercises 63-68, write the binomial probability...Ch. 5 - In Exercises 63-68, write the binomial probability...Ch. 5 - In Exercises 63-68, write the binomial probability...Ch. 5 - In Exercises 63-68, write the binomial probability...Ch. 5 - Prob. 5.5.68RECh. 5 - In Exercises 69 and 70, determine whether you can...Ch. 5 - In Exercises 69 and 70, determine whether you can...Ch. 5 - Find each probability using the standard normal...Ch. 5 - The random variable x is normally distributed with...Ch. 5 - In a standardized IQ test, scores are normally...Ch. 5 - In a standardized IQ test, scores are normally...Ch. 5 - In a standardized IQ test, scores are normally...Ch. 5 - In a standardized IQ test, scores are normally...Ch. 5 - In a standardized IQ test, scores are normally...Ch. 5 - In a standardized IQ test, scores are normally...Ch. 5 - In a standardized IQ test, scores are normally...Ch. 5 - Are you more likely to randomly select one person...Ch. 5 - In a survey of U.S. adults, 16% say they have had...Ch. 5 - In a survey of U.S. adults, 16% say they have had...Ch. 5 - Prob. 1CTCh. 5 - In Exercises 2-4, the random variable x is...Ch. 5 - In Exercises 2-4, the random variable x is...Ch. 5 - In Exercises 2-4, the random variable x is...Ch. 5 - In Exercises 5 and 6. determine whether you can...Ch. 5 - In Exercises 5 and 6. determine whether you can...Ch. 5 - The per capita disposable income for residents of...Ch. 5 - The per capita disposable income for residents of...Ch. 5 - The per capita disposable income for residents of...Ch. 5 - The per capita disposable income for residents of...Ch. 5 - EXERCISES 1. Sampling Individuals Assume the...Ch. 5 - Sampling Groups of Five Assume the machine shifts...Ch. 5 - Writing an Explanation Write a paragraph to your...Ch. 5 - A survey of adults in the United States found that...Ch. 5 - Prob. 2CRCh. 5 - In Exercises 2 and 3, find the (a) mean, (b)...Ch. 5 - Use the probability distribution in Exercise 3 to...Ch. 5 - From a pool of 16 candidates, 9 men and 7 women,...Ch. 5 - In Exercises 6-11, find the indicated area under...Ch. 5 - In Exercises 6-11, find the indicated area under...Ch. 5 - In Exercises 6-11, find the indicated area under...Ch. 5 - In Exercises 6-11, find the indicated area under...Ch. 5 - Prob. 10CRCh. 5 - In Exercises 6-11, find the indicated area under...Ch. 5 - Twenty-eight percent of U.S. adults think that...Ch. 5 - Prob. 13CRCh. 5 - Prob. 14CRCh. 5 - A survey of adults in the United States found that...Ch. 5 - The life spans of car batteries are normally...Ch. 5 - A florist has 12 different flowers from which...Ch. 5 - Seventy percent of U.S. adults anticipate major...
Knowledge Booster


Learn more about
Need a deep-dive on the concept behind this application? Look no further. Learn more about this topic, statistics and related others by exploring similar questions and additional content below.Similar questions
- A college wants to estimate what students typically spend on textbooks. A report fromthe college bookstore observes that textbooks range in price from $22 to $186. Toobtain a 95% confidence level for a confidence interval estimate to plus or minus $10,how many students should the college survey? (We may estimate the populationstandard deviation as (range) ÷ 4.)arrow_forwardIn a study of how students give directions, forty volunteers were given the task ofexplaining to another person how to reach a destination. Researchers measured thefollowing five aspects of the subjects’ direction-giving behavior:• whether a map was available or if directions were given from memory without a map,• the gender of the direction-giver,• the distances given as part of the directions,• the number of times directions such as “north” or “left” were used,• the frequency of errors in directions. Identify each of the variables in this study, and whether each is quantitative orqualitative. For each quantitative variable, state whether it is discrete or continuous. Was this an observational study or an experimental study? Explain your answer.arrow_forwardexplain the difference between the confident interval and the confident level. provide an example to show how to correctly interpret a confidence interval.arrow_forward
- Sketch to scale the orbit of Earth about the sun. Graph Icarus’ orbit on the same set of axesWhile the sun is the center of Earth’s orbit, it is a focus of Icarus’ orbit. There aretwo points of intersection on the graph. Based on the graph, what is the approximate distance between the two points of intersection (in AU)?arrow_forwardThe diameters of ball bearings are distributed normally. The mean diameter is 67 millimeters and the standard deviation is 3 millimeters. Find the probability that the diameter of a selected bearing is greater than 63 millimeters. Round to four decimal places.arrow_forwardSuppose you like to keep a jar of change on your desk. Currently, the jar contains the following: 22 Pennies 27 Dimes 9 Nickels 30 Quarters What is the probability that you reach into the jar and randomly grab a penny and then, without replacement, a dime? Express as a fraction or a decimal number rounded to four decimal places.arrow_forward
- A box contains 14 large marbles and 10 small marbles. Each marble is either green or white. 9 of the large marbles are green, and 4 of the small marbles are white. If a marble is randomly selected from the box, what is the probability that it is small or white? Express as a fraction or a decimal number rounded to four decimal places.arrow_forwardCan I get help with this step please? At a shooting range, instructors can determine if a shooter is consistently missing the target because of the gun sight or because of the shooter's ability. If a gun's sight is off, the variance of the distances between the shots and the center of the shot pattern will be small (even if the shots are not in the center of the target). A student claims that it is the sight that is off, not his aim, and wants the instructor to confirm his claim. If a skilled shooter fires a gun at a target multiple times, the distances between the shots and the center of the shot pattern, measured in centimeters (cm), will have a variance of less than 0.33. After the student shoots 28 shots at the target, the instructor calculates that the distances between his shots and the center of the shot pattern, measured in cm, have a variance of 0.25. Does this evidence support the student's claim that the gun's sight is off? Use a 0.025 level of significance. Assume that the…arrow_forwardThe National Academy of Science reported that 38% of research in mathematics is published by US authors. The mathematics chairperson of a prestigious university wishes to test the claim that this percentage is no longer 38%. He has no indication of whether the percentage has increased or decreased since that time. He surveys a simple random sample of 279 recent articles published by reputable mathematics research journals and finds that 123 of these articles have US authors. Does this evidence support the mathematics chairperson's claim that the percentage is no longer 38 % ? Use a 0.02 level of significance. Compute the value of the test statistic. Round to two decimal places.arrow_forward
- A marketing research company desires to know the mean consumption of milk per week among males over age 32. They believe that the milk consumption has a mean of 4 liters, and want to construct a 98% confidence interval with a maximum error of 0.07 liters. Assuming a variance of 0.64 liters, what is the minimum number of males over age 32 they must include in their sample? Round up to the next integer.arrow_forwardSuppose GRE Verbal scores are normally distributed with a mean of 461 and a standard deviation of 118. A university plans to recruit students whose scores are in the top 4 % . What is the minimum score required for recruitment? Round to the nearest whole number, if necessaryarrow_forwardNeed help with my homework thank you random sample of 6 fields of durum wheat has a mean yield of 45.5 bushels per acre and standard deviation of 7.43 bushels per acre. Determine the 80 % confidence interval for the true mean yield. Assume the population is approximately normal. Step 1: Find the critical value that should be used in constructing the confidence interval. Round to three decimal places. Step 2 of 2: Construct the 80% confidence interval. Round to one decimal place. I got 1.476 as my critical value and 41.0 and 49.9 as my confidence intervalarrow_forward
arrow_back_ios
SEE MORE QUESTIONS
arrow_forward_ios
Recommended textbooks for you
 Big Ideas Math A Bridge To Success Algebra 1: Stu...AlgebraISBN:9781680331141Author:HOUGHTON MIFFLIN HARCOURTPublisher:Houghton Mifflin Harcourt
 Glencoe Algebra 1, Student Edition, 9780079039897...AlgebraISBN:9780079039897Author:CarterPublisher:McGraw Hill
 Trigonometry (MindTap Course List)TrigonometryISBN:9781305652224Author:Charles P. McKeague, Mark D. TurnerPublisher:Cengage Learning
 Trigonometry (MindTap Course List)TrigonometryISBN:9781337278461Author:Ron LarsonPublisher:Cengage Learning
Big Ideas Math A Bridge To Success Algebra 1: Stu...
Algebra
ISBN:9781680331141
Author:HOUGHTON MIFFLIN HARCOURT
Publisher:Houghton Mifflin Harcourt
Glencoe Algebra 1, Student Edition, 9780079039897...
Algebra
ISBN:9780079039897
Author:Carter
Publisher:McGraw Hill
Trigonometry (MindTap Course List)
Trigonometry
ISBN:9781305652224
Author:Charles P. McKeague, Mark D. Turner
Publisher:Cengage Learning
Trigonometry (MindTap Course List)
Trigonometry
ISBN:9781337278461
Author:Ron Larson
Publisher:Cengage Learning
Which is the best chart: Selecting among 14 types of charts Part II; Author: 365 Data Science;https://www.youtube.com/watch?v=qGaIB-bRn-A;License: Standard YouTube License, CC-BY