
Concept explainers
Videos
(a)
To find:
The area under the graph using right endpoints and three rectangles and then area under the graph using right endpoints and six rectangles.
(a)
Answer to Problem 5E
The area under the graph using right endpoints and three rectangles is 8 and the area under the graph using right endpoints and six rectangles is 6.875.
Explanation of Solution
Given:
The curve function is
The region lies between
Calculation:
Draw the graph for the function
The expression to find the estimate of the areas of n rectangles
Here, the right endpoint height of the first rectangle is
Find the width
Here, the upper limit is b, the lower limit is a, and the number of rectangles is n.
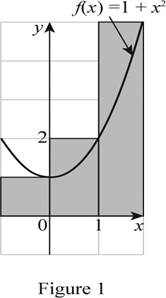
Find the area estimate for three rectangles with right end points.
Substitute 2 for b, -1 for a, and 3 for n in Equation (2).
From Figure (1), take the right endpoint height of the first rectangle’s
Substitute 3 for n, 1 for
Therefore, the estimate using right endpoints for
Draw the graph for the function
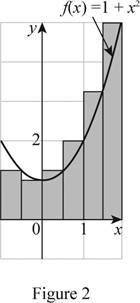
Find the area estimate for six rectangles with right end points.
Substitute 2 for b, -1 for a, and 6 for n in equation (2).
From Figure (2), take the right endpoint height of the rectangle’s
Substitute 6 for n, and the above height of the rectangle’s in equation (1),
Therefore, the estimate using right endpoints for
(b)
The area under the graph using left endpoints and three rectangles and then area under the graph using left endpoints and six rectangles.
(b)
Answer to Problem 5E
The area under the graph using left endpoints and three rectangles is 5 and then area under the graph using left endpoints and six rectangles 5.375.
Explanation of Solution
Draw the graph for the function
The expression to find the estimate of the areas of n rectangles
Here, the left endpoint height of the first rectangle is
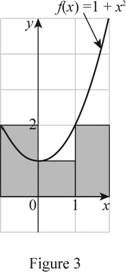
Find the area estimate for three rectangles with left end points:
From Figure (3), take the left endpoint height of the first rectangle’s
Substitute 3 for n, and the above height of the rectangle’s in equation (3),
Therefore, the estimate using left endpoints for
Draw the graph for the function
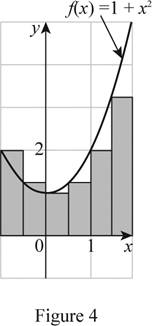
Find the area estimate for six rectangles with left end points:
From Figure (4), take the left endpoint height of the rectangle’s
Substitute 6 for n, 2 for
Therefore, the estimate using left endpoints for
(c)
The area under the graph using midpoints and three rectangles and then area under the graph using midpoints and six rectangles.
(c)
Answer to Problem 5E
The area under the graph using midpoints is 5.75 and three rectangles and then area under the graph using midpoints and six rectangles is 5.95.
The area under the graph using mid points and three rectangles is 5.75.
The area under the graph using mid points and six rectangles is 5.95.
Explanation of Solution
Draw the graph for the function
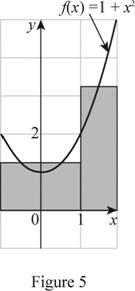
The expression to find the estimate of the areas of n rectangles
Here, the midpoint height of the first rectangle is
From Figure (5), take the right endpoint height of the rectangle’s
Substitute 3 for n, and the above height of the rectangle’s in equation (4),
Therefore, the estimate using midpoints for
Draw the graph for the function
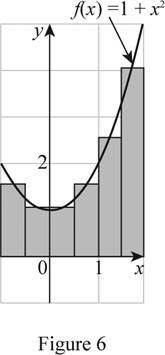
Find the area estimate for six rectangles with midpoints:
From Figure (6), take the right endpoint height of the rectangle’s
Substitute 6 for n, and the above height of the rectangle’s in equation (4),
Therefore, the estimate using midpoints for
(d)
To find:
The best estimate.
(d)
Answer to Problem 5E
The midpoint estimate value seems to be the best estimate.
Explanation of Solution
Analyze the best estimate among the estimates:
From part (a), part (b), and part (c), the estimates using right endpoints with three and six rectangles shows an overestimate of the true area and the estimate using left endpoints shows an underestimate of the true area.
The mid estimate of the area using midpoints with three and six rectangles shows the area of each rectangle which appears closer to the true area.
Hence, the mid estimate represents to the best estimate
Chapter 5 Solutions
Single Variable Calculus: Concepts and Contexts, Enhanced Edition


- Determine the radius of convergence of a power series:12.6.5, 12.6.6, 12.6.7, 12.6.8Hint: Use Theorem12.5.1 and root test, ratio test, integral testarrow_forwardCan you answer this question and give step by step and why and how to get it. Can you write it (numerical method)arrow_forwardCan you answer this question and give step by step and why and how to get it. Can you write it (numerical method)arrow_forward
- There are three options for investing $1150. The first earns 10% compounded annually, the second earns 10% compounded quarterly, and the third earns 10% compounded continuously. Find equations that model each investment growth and use a graphing utility to graph each model in the same viewing window over a 20-year period. Use the graph to determine which investment yields the highest return after 20 years. What are the differences in earnings among the three investment? STEP 1: The formula for compound interest is A = nt = P(1 + − − ) n², where n is the number of compoundings per year, t is the number of years, r is the interest rate, P is the principal, and A is the amount (balance) after t years. For continuous compounding, the formula reduces to A = Pert Find r and n for each model, and use these values to write A in terms of t for each case. Annual Model r=0.10 A = Y(t) = 1150 (1.10)* n = 1 Quarterly Model r = 0.10 n = 4 A = Q(t) = 1150(1.025) 4t Continuous Model r=0.10 A = C(t) =…arrow_forwardUse a graphing utility to find the point of intersection, if any, of the graphs of the functions. Round your result to three decimal places. (Enter NONE in any unused answer blanks.) y = 100e0.01x (x, y) = y = 11,250 ×arrow_forward5. For the function y-x³-3x²-1, use derivatives to: (a) determine the intervals of increase and decrease. (b) determine the local (relative) maxima and minima. (e) determine the intervals of concavity. (d) determine the points of inflection. (e) sketch the graph with the above information indicated on the graph.arrow_forward
- Can you solve this 2 question numerical methodarrow_forward1. Estimate the area under the graph of f(x)-25-x from x=0 to x=5 using 5 approximating rectangles Using: (A) right endpoints. (B) left endpoints.arrow_forward9. Use fundamental theorem of calculus to find the derivative d a) *dt sin(x) b)(x)√1-2 dtarrow_forward
- 3. Evaluate the definite integral: a) √66x²+8dx b) x dx c) f*(2e* - 2)dx d) √√9-x² e) (2-5x)dx f) cos(x)dx 8)²₁₂√4-x2 h) f7dx i) f² 6xdx j) ²₂(4x+3)dxarrow_forward2. Consider the integral √(2x+1)dx (a) Find the Riemann sum for this integral using right endpoints and n-4. (b) Find the Riemann sum for this same integral, using left endpoints and n=4arrow_forwardProblem 11 (a) A tank is discharging water through an orifice at a depth of T meter below the surface of the water whose area is A m². The following are the values of a for the corresponding values of A: A 1.257 1.390 x 1.50 1.65 1.520 1.650 1.809 1.962 2.123 2.295 2.462|2.650 1.80 1.95 2.10 2.25 2.40 2.55 2.70 2.85 Using the formula -3.0 (0.018)T = dx. calculate T, the time in seconds for the level of the water to drop from 3.0 m to 1.5 m above the orifice. (b) The velocity of a train which starts from rest is given by the fol- lowing table, the time being reckoned in minutes from the start and the speed in km/hour: | † (minutes) |2|4 6 8 10 12 14 16 18 20 v (km/hr) 16 28.8 40 46.4 51.2 32.0 17.6 8 3.2 0 Estimate approximately the total distance ran in 20 minutes.arrow_forward
 Calculus: Early TranscendentalsCalculusISBN:9781285741550Author:James StewartPublisher:Cengage Learning
 Thomas' Calculus (14th Edition)CalculusISBN:9780134438986Author:Joel R. Hass, Christopher E. Heil, Maurice D. WeirPublisher:PEARSON
 Calculus: Early Transcendentals (3rd Edition)CalculusISBN:9780134763644Author:William L. Briggs, Lyle Cochran, Bernard Gillett, Eric SchulzPublisher:PEARSON
 Calculus: Early TranscendentalsCalculusISBN:9781319050740Author:Jon Rogawski, Colin Adams, Robert FranzosaPublisher:W. H. Freeman
 Calculus: Early Transcendental FunctionsCalculusISBN:9781337552516Author:Ron Larson, Bruce H. EdwardsPublisher:Cengage Learning