Concept explainers
Plot the shear diagram, bending moment diagram, axial force diagram, and the qualitative deflected shape of the frame.
Explanation of Solution
Write the condition for static instability, determinacy and indeterminacy of plane frames as follows:
Here, number of members is m, number of external reactions is r, the number of joints is j, and the number of elastic hinges is
Find the degree of static indeterminacy (i) using the equation;
Refer to the Figure in the question;
The number of members (m) is 3.
The number of external reactions (r) is 6.
The number of joints (j) is 4.
The number of elastic hinges
Substitute the values in Equation (2);
Show the free-body diagram of the entire frame as in Figure 1.
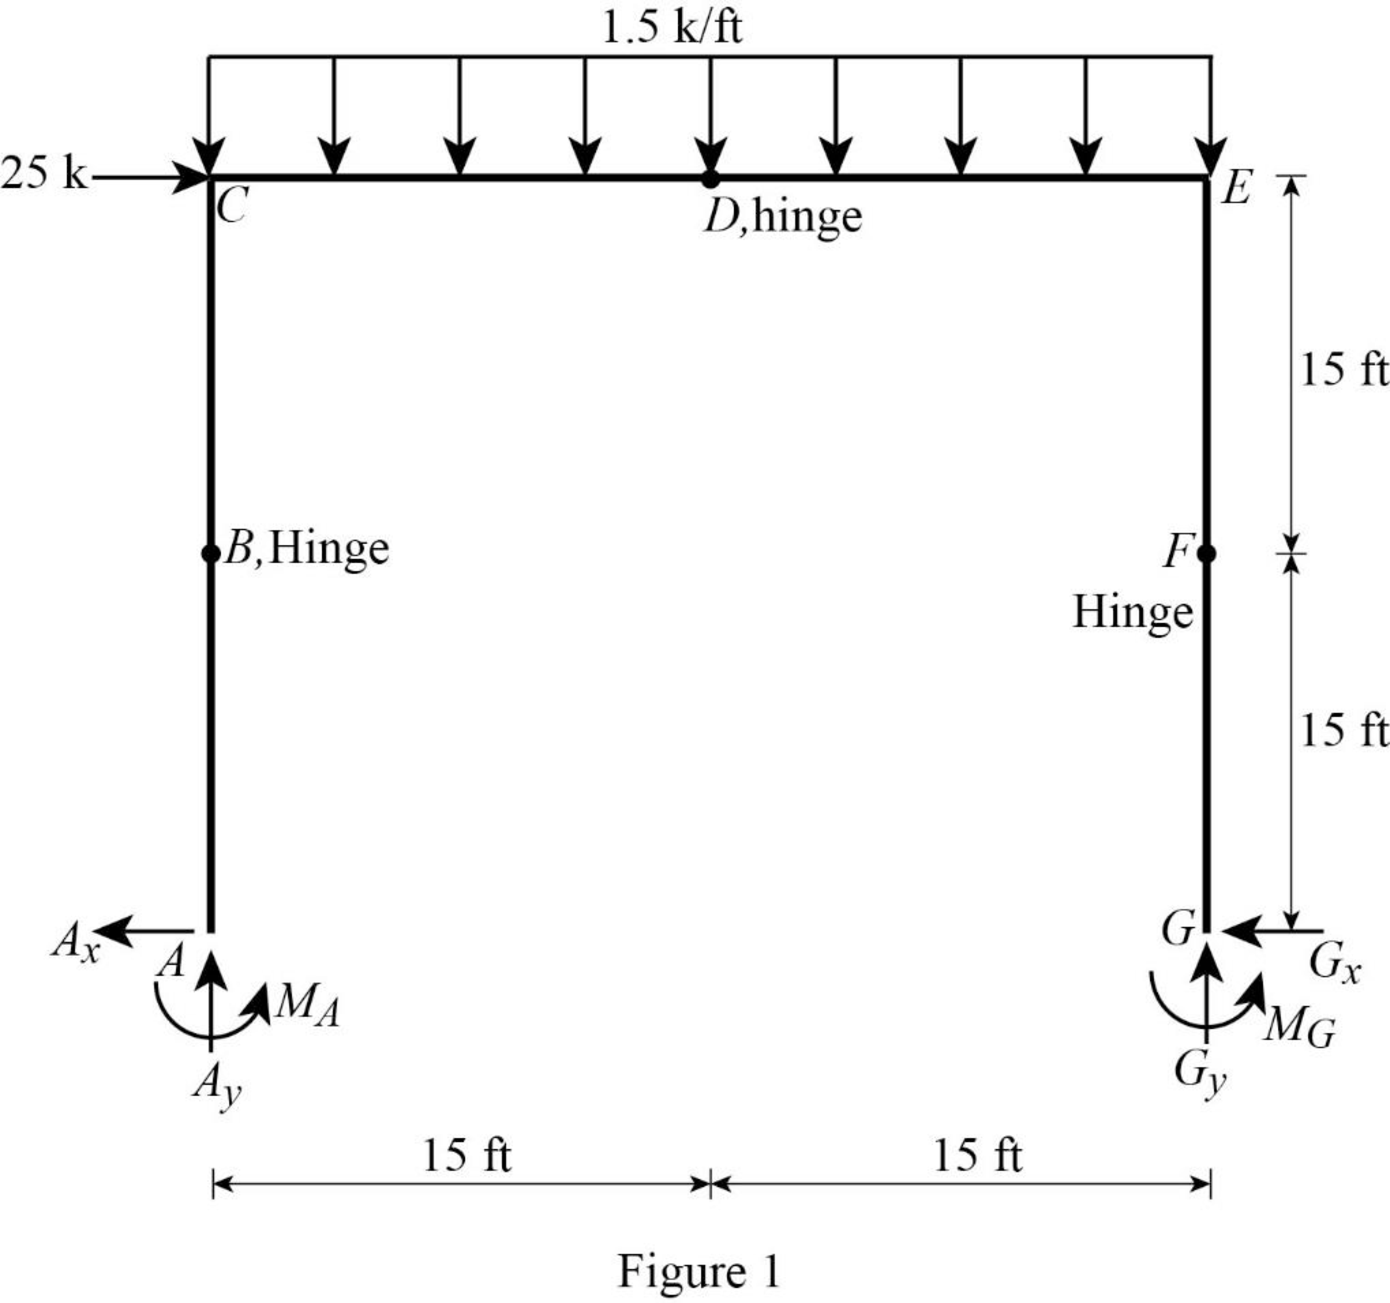
Refer Figure 1,
Consider the section BCDEFG:
Take moment about point B:
Consider the section DEFG:
Take moment about point D:
Consider the section FG:
Take moment about point F:
Solve the Equations (1), (2), and (3) simultaneously.
Consider entire frame:
Find the vertical reaction at point A by resolving the vertical component of forces.
Find the moment at point A by taking moment about point A.
Find the horizontal reaction at point A by resolving the horizontal component of forces.
Show the free-body diagram of the members and joints of the entire frame as in Figure 2.
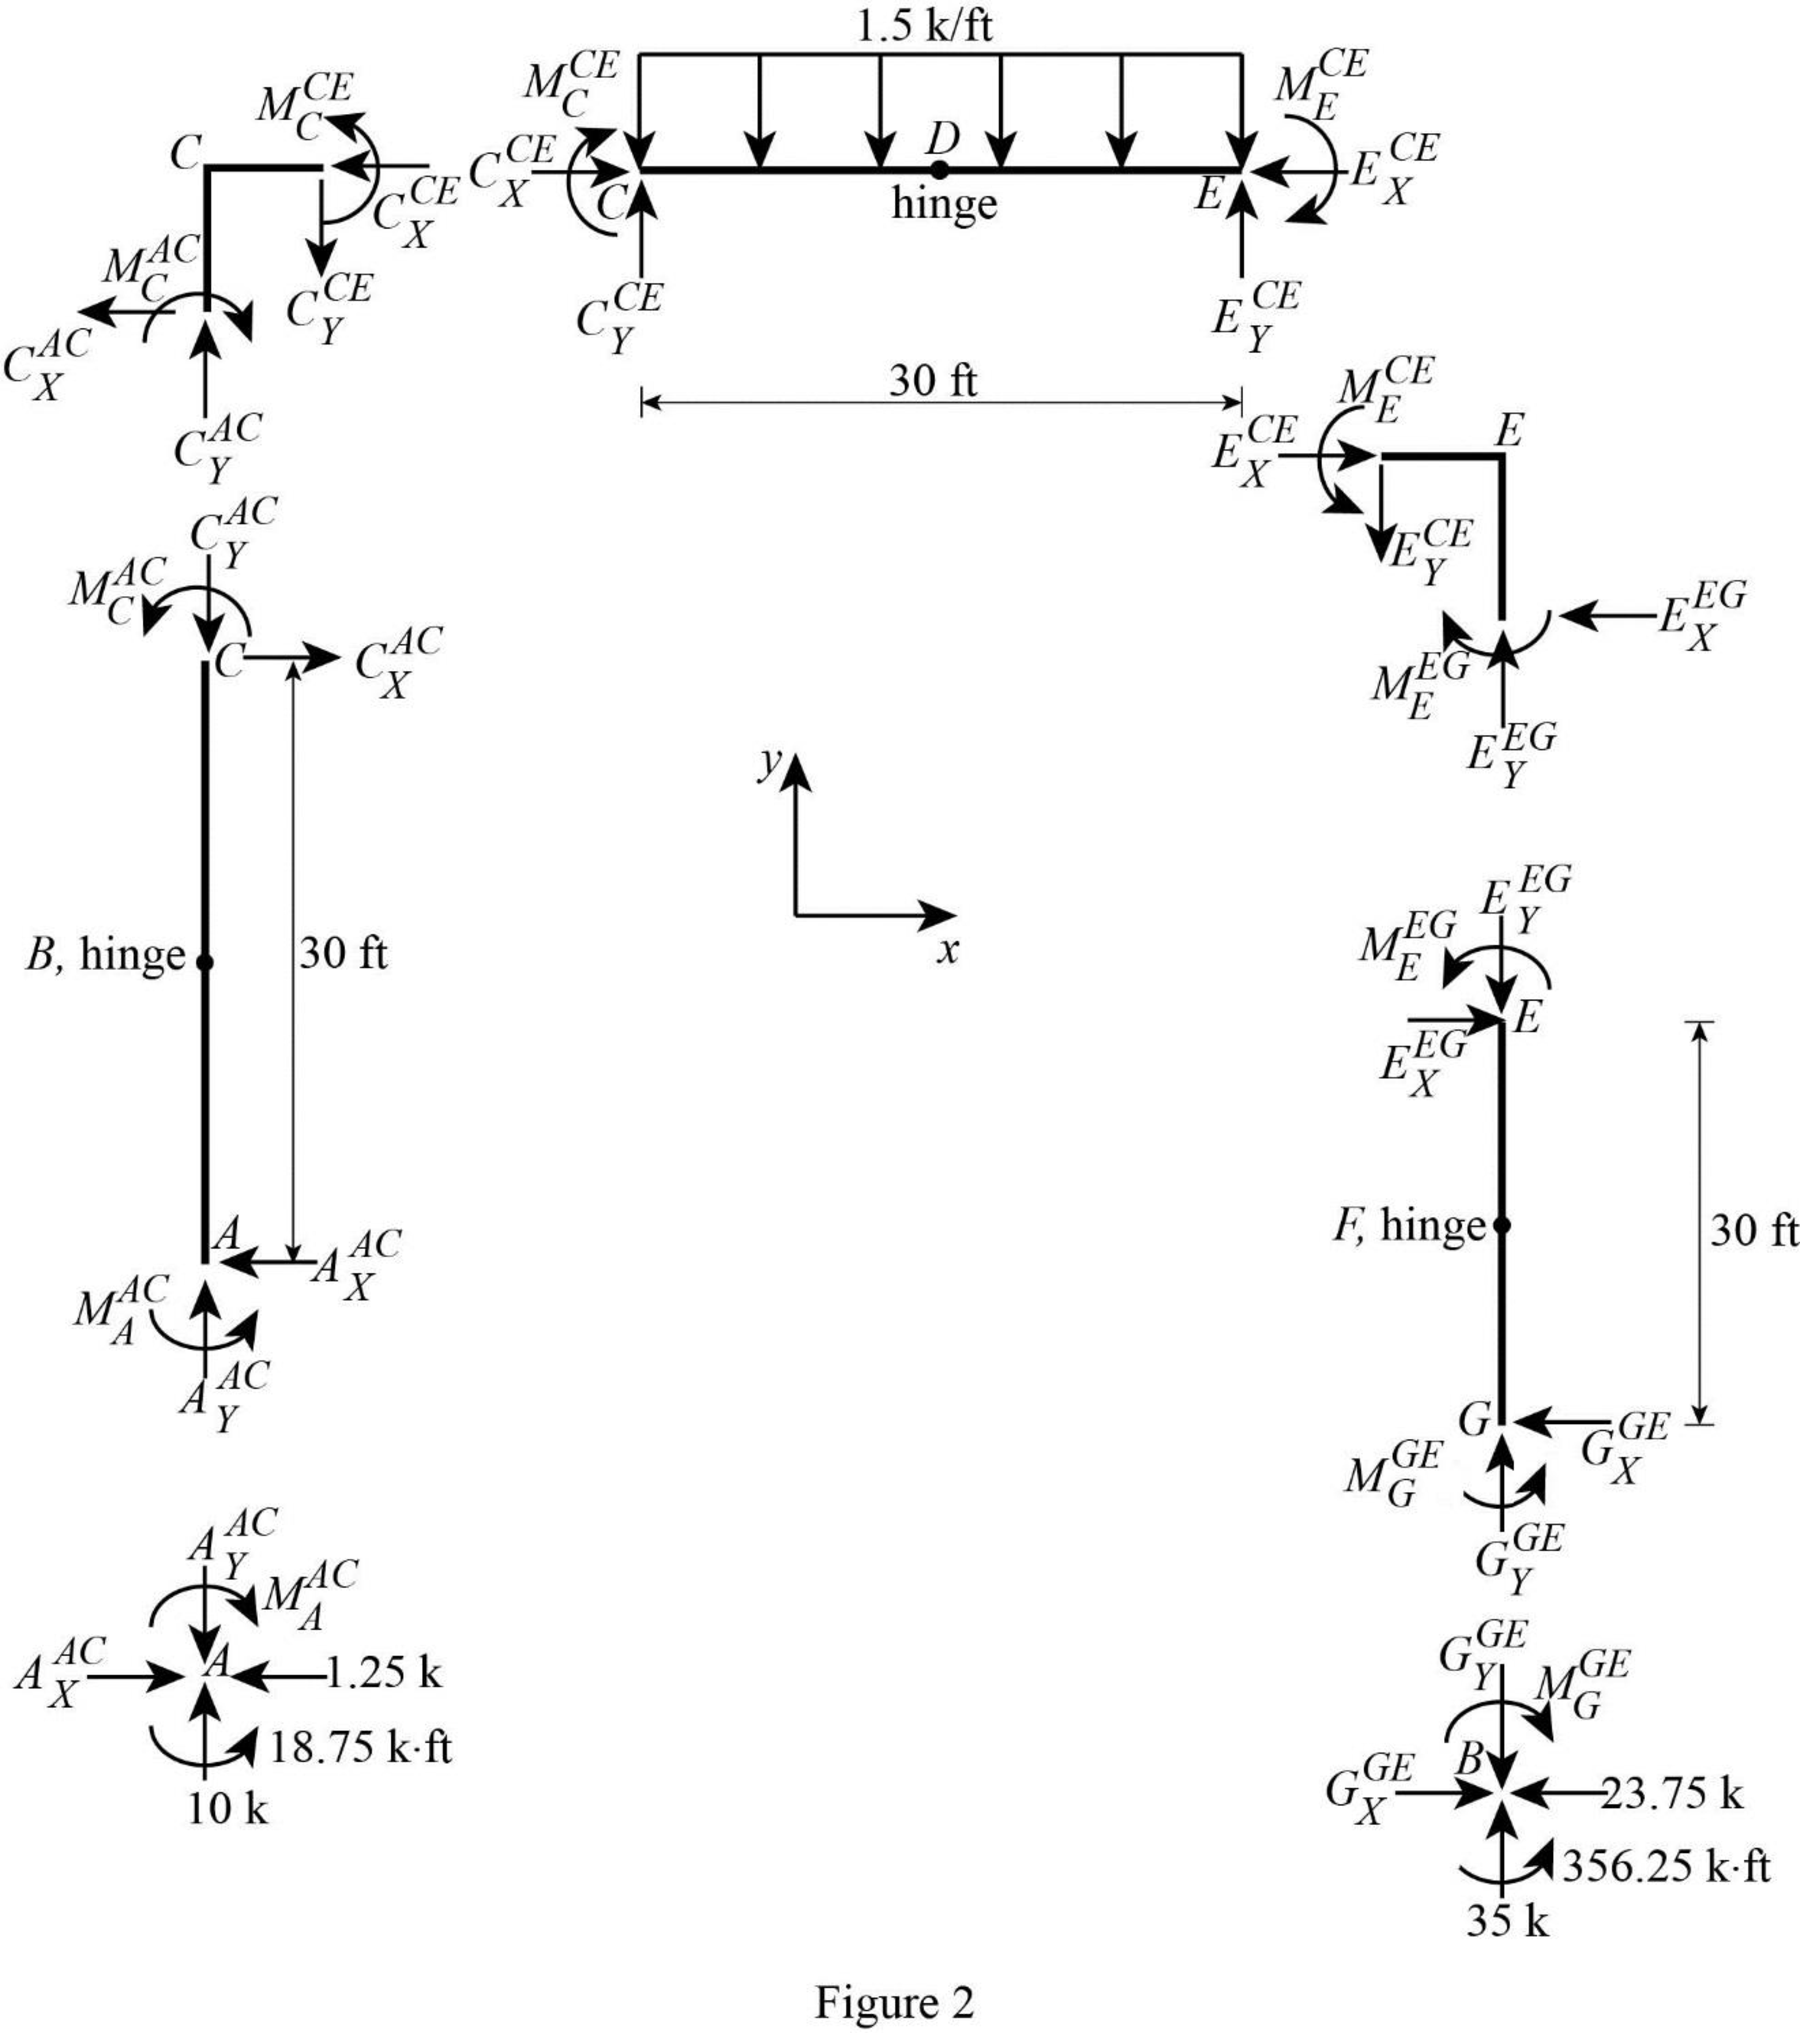
Consider point A:
Resolve the vertical component of forces.
Resolve the horizontal component of forces.
Take moment about the point A.
Consider the member AC:
Resolve the vertical component of forces.
Resolve the horizontal component of forces.
Take moment about the point C.
Consider the point C:
Resolve the vertical component of forces.
Resolve the horizontal component of forces.
Take moment about the point C.
Consider the member CDE:
Resolve the vertical component of forces.
Resolve the horizontal component of forces.
Take moment about the point E.
Consider the point E:
Resolve the vertical component of forces.
Resolve the horizontal component of forces.
Take moment about the point E.
Consider the point G:
Resolve the vertical component of forces.
Resolve the horizontal component of forces.
Take moment about the point G.
Plot the moment end forces of the frame as in Figure 3.
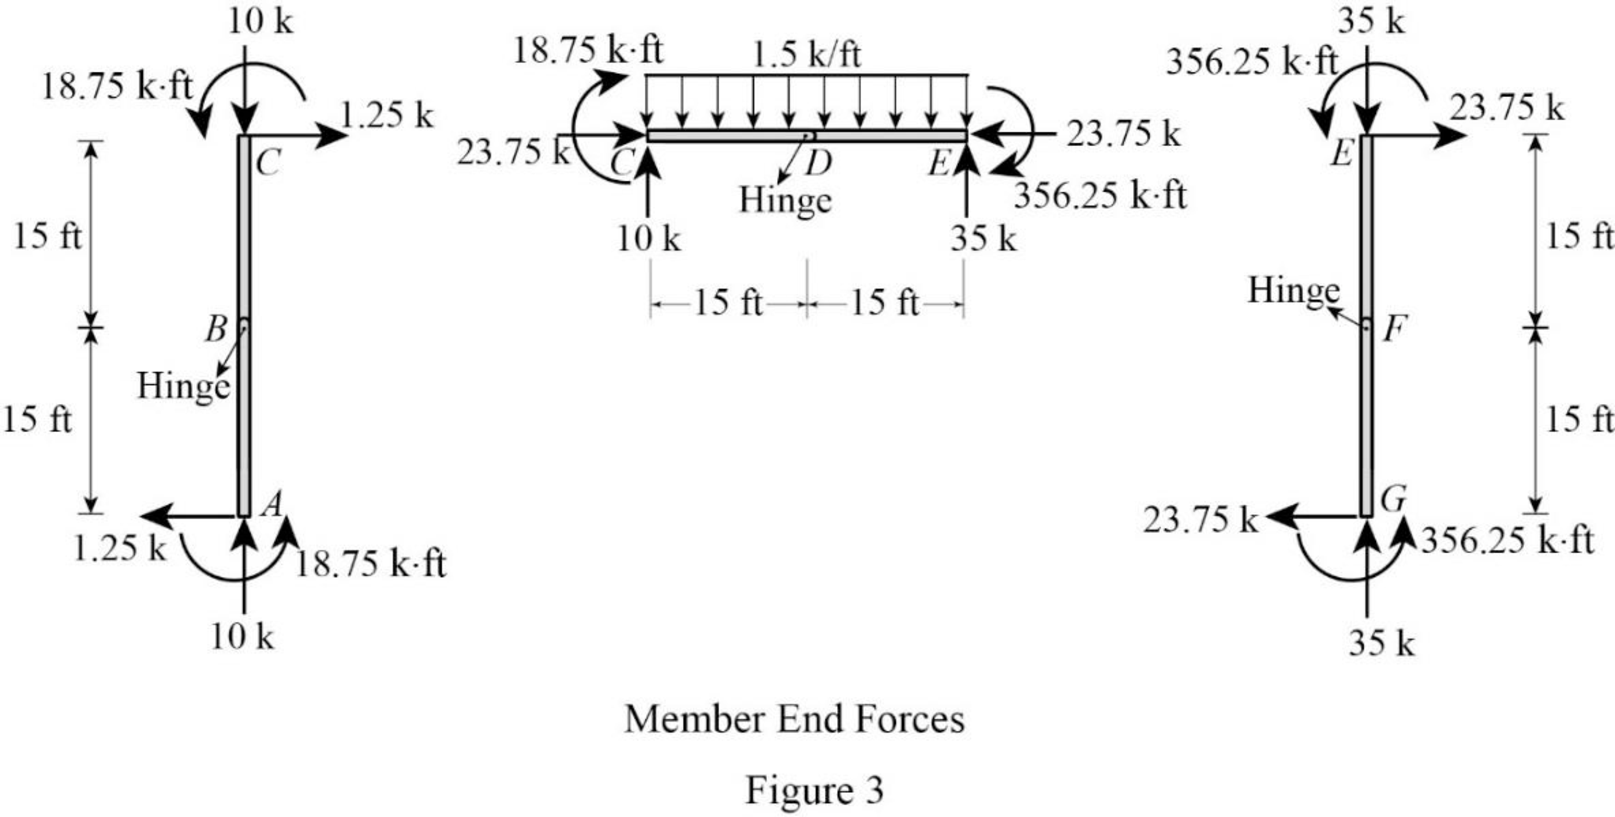
Refer to the moment end force diagram plot the shear diagram, bending moment diagram, and the axial force diagrams.
Plot the shear force diagram as in Figure 4.
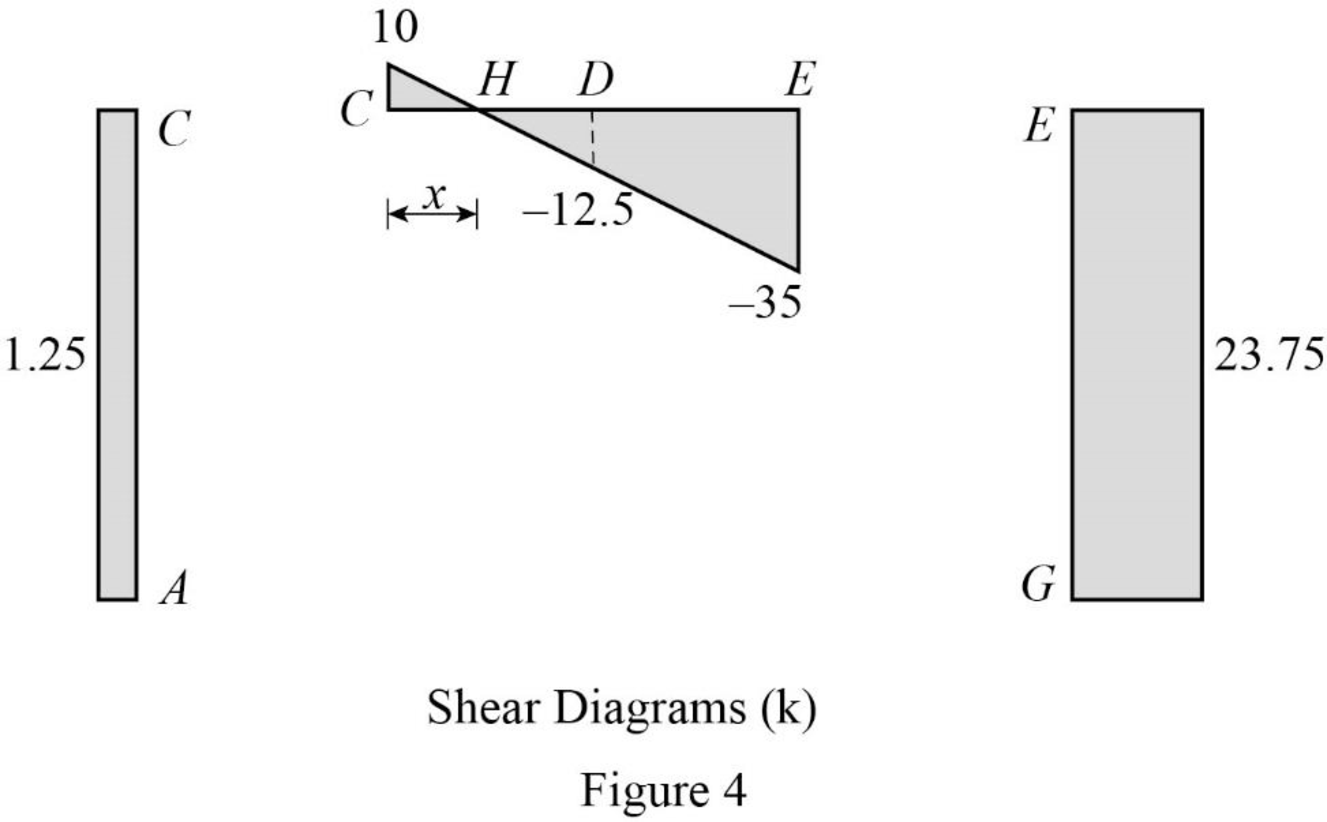
Refer to the shear force diagram, the maximum bending moment occurs at point F where the shear force changes sign.
Use similar triangle concept for the region CE:
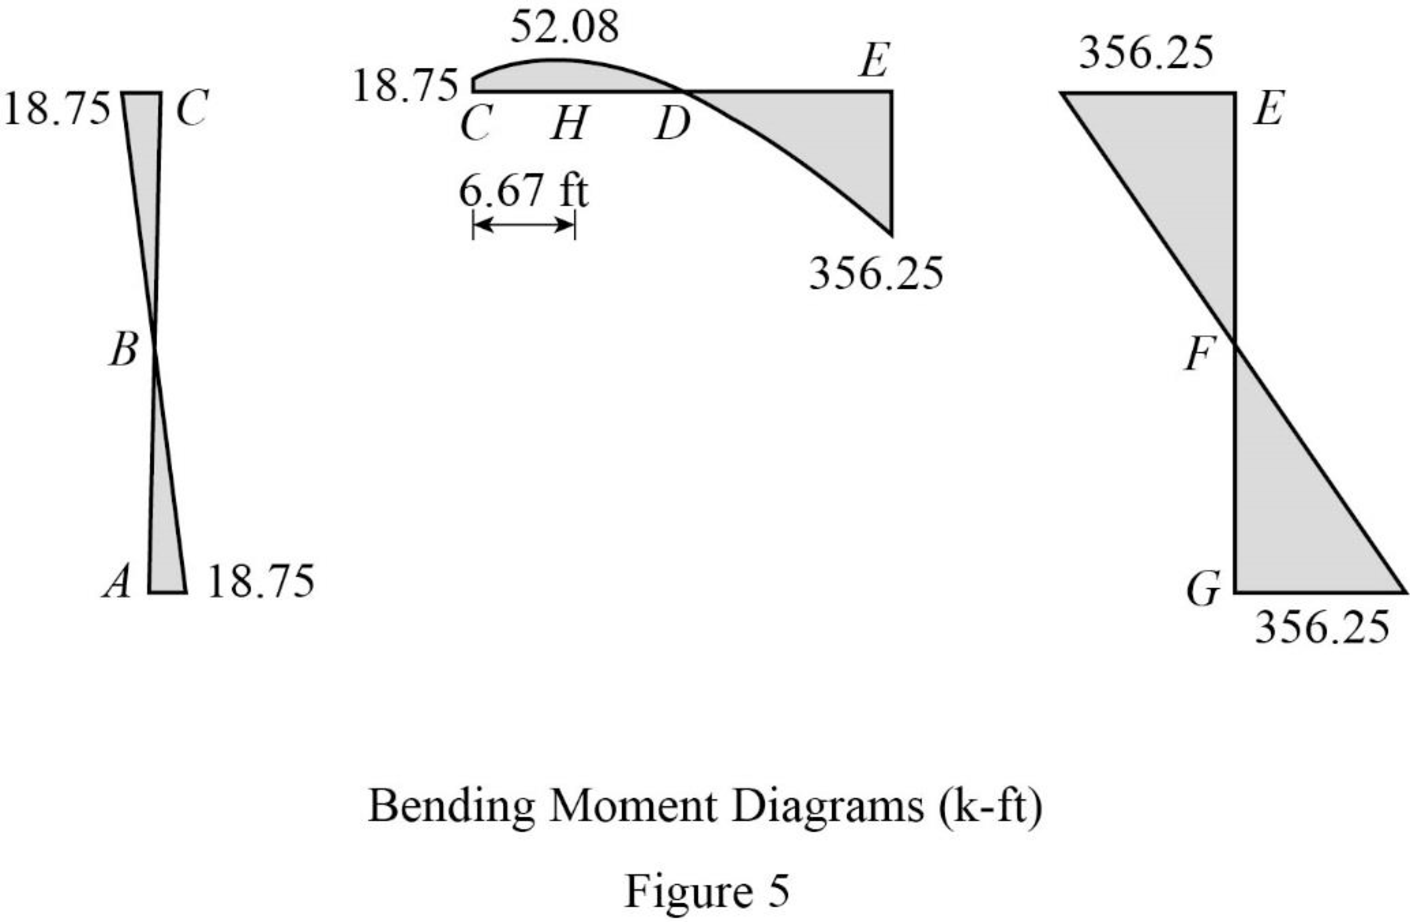
Plot the bending moment diagram as in Figure 5.
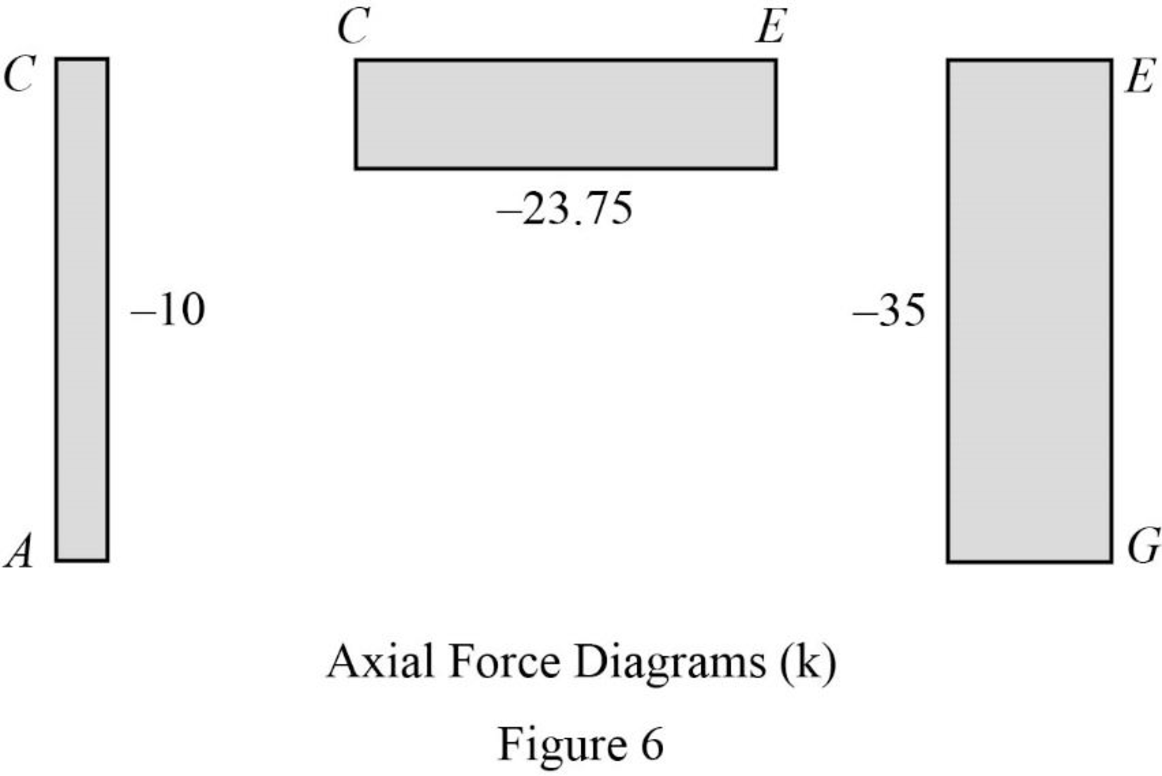
Plot the axial force diagram as in Figure 6.
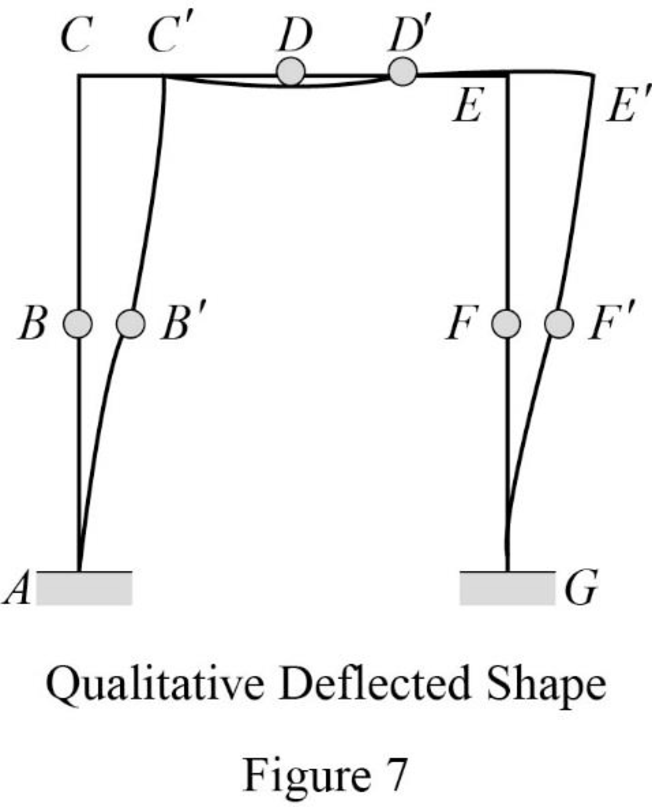
Plot the qualitative deflected shape as in Figure 7.
Want to see more full solutions like this?
Chapter 5 Solutions
Structural Analysis (MindTap Course List)


- Draw the Shear Force Diagram and Bending Moment Diagram for the beam shown in Fig.1. The beam is subjected to an UDL of w=65m. L=4.5m L1= 1.8m. Assume the support at C is pinned, and A and B are roller supports. E = 200GPa, I = 250x106 mm4.arrow_forwardCalculate the BMs (bending moments) at all the joints of the beam shown in Fig.1 using the Slope Deflection method. The beam is subjected to an UDL of w=65m. L=4.5m L1= 1.8m. Assume the support at C is pinned, and A and B are roller supports. E = 200GPa, I = 250x106 mm4.arrow_forwardText Book Problem 7.82 (page 261) Consider the total head-loss in the system forthis flow is 18.56 ft (head-losses in first and second pipe are 13.83 ft and 4.73 ftrespectively). Please show numerical values for EGL/HGL at the beginning/end/intermediatechange point. (Point distribution: elevation determination 5 points, EGL, HGL lines 4points).(I think we are just using the values provided for head losses to solve this problem)arrow_forward
- Calculate the BMs (bending moments) at all the joints of the beam shown in Fig.1 using the moment distribution method, and draw the Shear force diagram and Bending moment diagram for the beam shown. The beam is subjected to an UDL of w=65m. L=4.5m L1= 1.8m. Assume the support at C is pinned, and A and B are roller supports. E = 200GPa, I = 250x106 mm4.arrow_forwardCalculate the BMs (bending moments) at all the joints of the beam shown in Fig.1 using the Slope deflection method. The beam is subjected to an UDL of w=65m. L=4.5m L1= 1.8m. Assume the support at C is pinned, and A and B are roller supports. E = 200GPa, I = 250x106 mm4.arrow_forwardThank you for your help if you would also provide the equations used .arrow_forward
- The sectors are divided as follows:top right = 1, top left = 2, middle = 3, bottom = 4.(a) Determine the distance yˉ to the centroid of the beam’s cross-sectional area.Solve the next questions by building a table. (Table format Answers) (b) Determine the second moment of area (moment of inertia) about the x′ axis. (c) Determine the second moment of area (moment of inertia) about the y-axis.arrow_forwardinstructions: make sure to follow the instructions and provide complete and detailed solution create/draw a beam with uniformly distributed load and concentrated load after, find the shear and moment equation and ensure to draw it's shear and moment diagram once done, write it's conclusion or observation 4:57 PMarrow_forwardSolve for forces on pin C and Darrow_forward
- Borrow pit soil is being used to fill an 900,00 yd3 of depression. The properties of borrowpit and in-place fill soils obtained from laboratory test results are as follows:• Borrow pit soil: bulk density 105 pcf, moisture content = 8%, and specific gravity = 2.65• In-place fill soil: dry unit weight =120 pcf, and moisture content = 16%(a) How many yd3 of borrow soil is required?(b) What water mass is needed to achieve 16% moisture in the fill soil?(c) What is the in-place density after a long rain?arrow_forwardsolve for dt/dx=f(t,x)=x+t^2arrow_forwardCalculate the BMs (bending moments) at all the joints of the beam shown in Fig.1 using the slope deflection method, draw the resulting shear force diagran and bending moment diagram. The beam is subjected to an UDL of w=65m. L=4.5m, L1= 1.8m. Assume the support at C is pinned, and A and B are roller supports. E = 200 GPa, I = 250x106 mm4.arrow_forward
