Concept explainers
Plot the shear diagram, bending moment diagram, axial force diagram, and the qualitative deflected shape of the frame.
Explanation of Solution
Write the condition for static instability, determinacy and indeterminacy of plane frames as follows:
Here, number of members is m, number of external reactions is r, the number of joints is j, and the number of elastic hinges is
Find the degree of static indeterminacy (i) using the equation;
Refer to the Figure in the question;
The number of members (m) is 3.
The number of external reactions (r) is 3.
The number of joints (j) is 4.
The number of elastic hinges
Substitute the values in Equation (2);
Show the free-body diagram of the entire frame as in Figure 1.
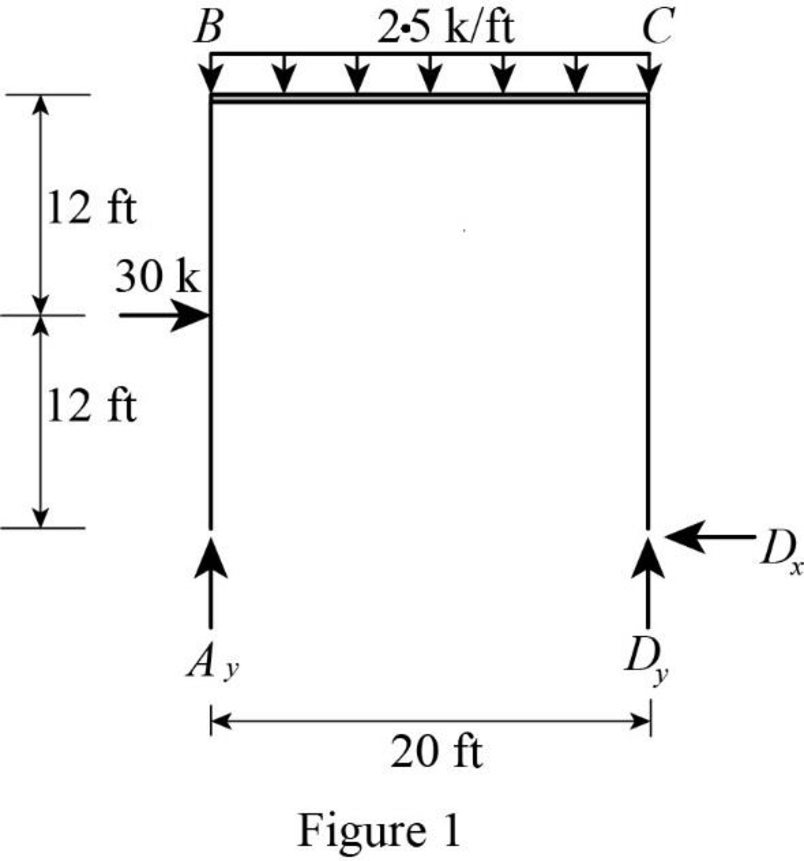
Refer Figure 1,
Find the vertical reaction at point D by taking moment about point A.
Find the vertical reaction at point A by resolving the vertical component of forces.
Find the horizontal reaction at point D by resolving the horizontal component of forces.
Show the free-body diagram of the members and joints of the entire frame as in Figure 2.
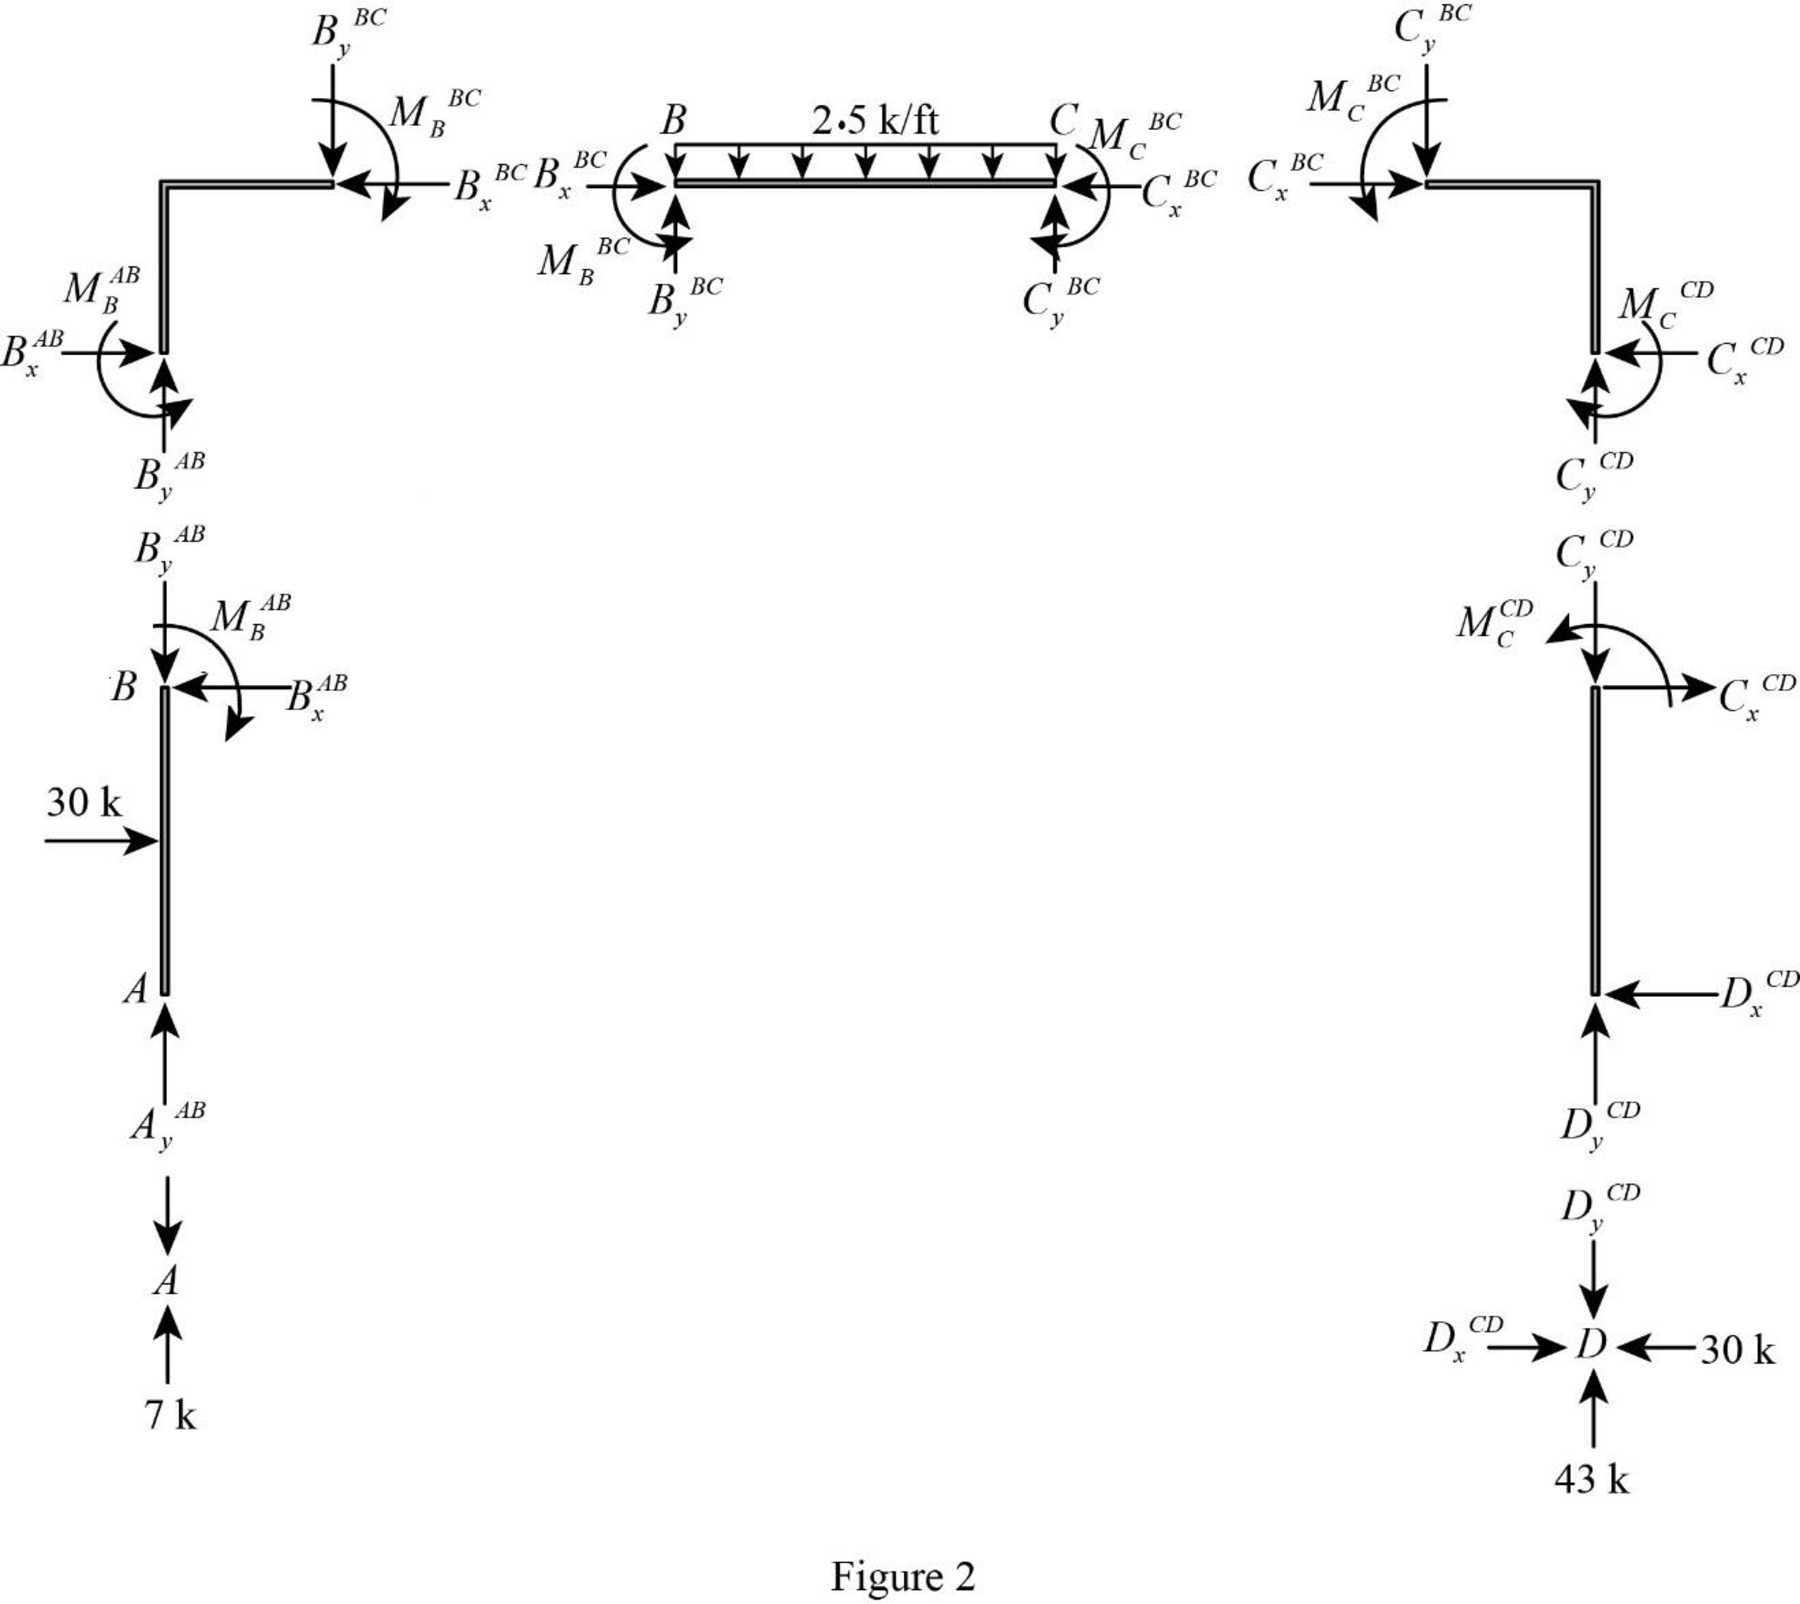
Consider point A:
Resolve the vertical component of forces.
Consider the member AB:
Resolve the vertical component of forces.
Resolve the horizontal component of forces.
Take moment about the point B.
Consider the point B:
Resolve the vertical component of forces.
Resolve the horizontal component of forces.
Take moment about the point B.
Consider the member BC:
Resolve the vertical component of forces.
Resolve the horizontal component of forces.
Take moment about the point C.
Consider the point C:
Resolve the vertical component of forces.
Resolve the horizontal component of forces.
Take moment about the point C.
Consider the point D:
Resolve the vertical component of forces.
Resolve the horizontal component of forces.
Plot the moment end forces of the frame as in Figure 3.
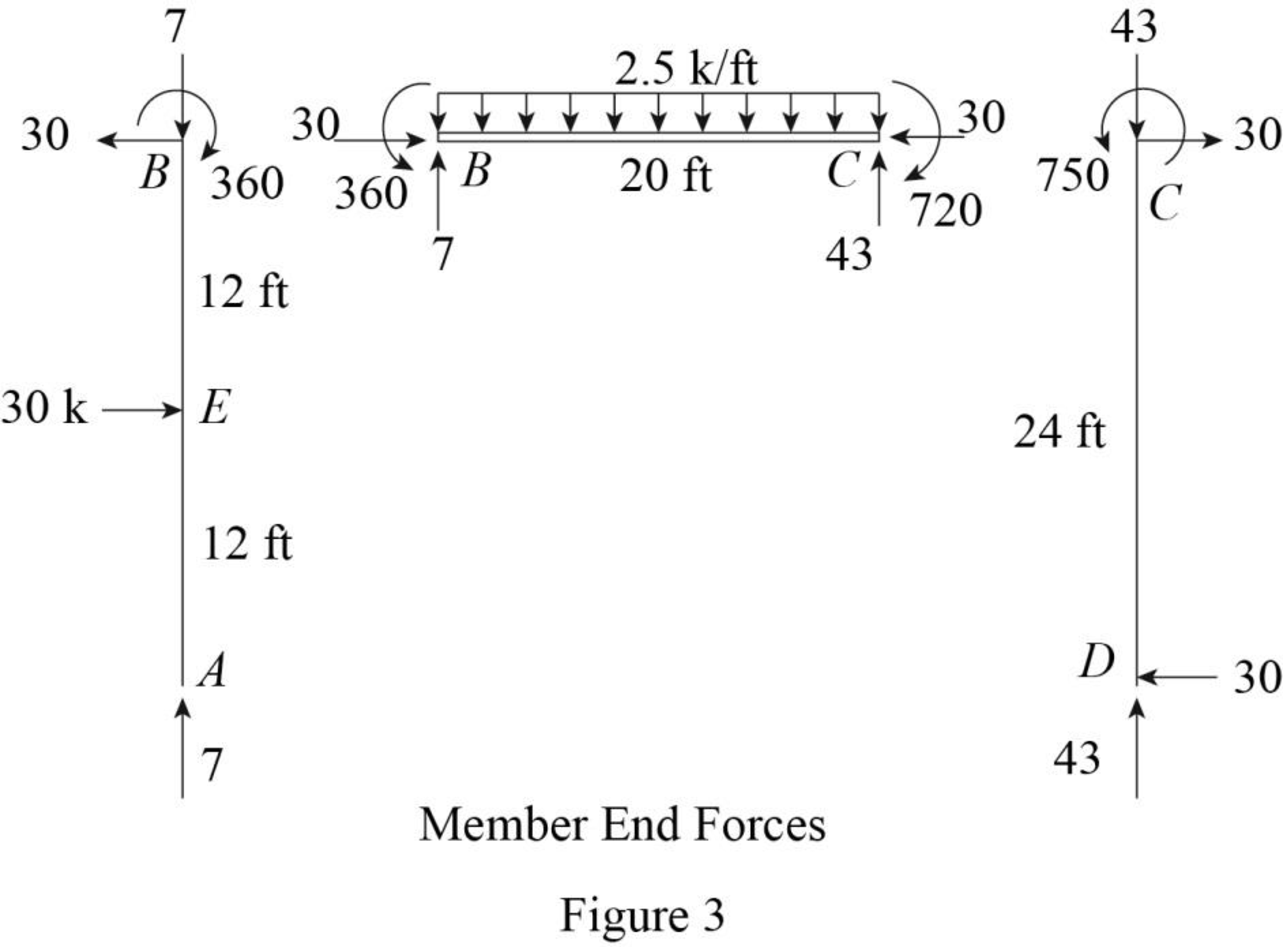
Refer to the moment end force diagram plot the shear diagram, bending moment diagram, and the axial force diagrams.
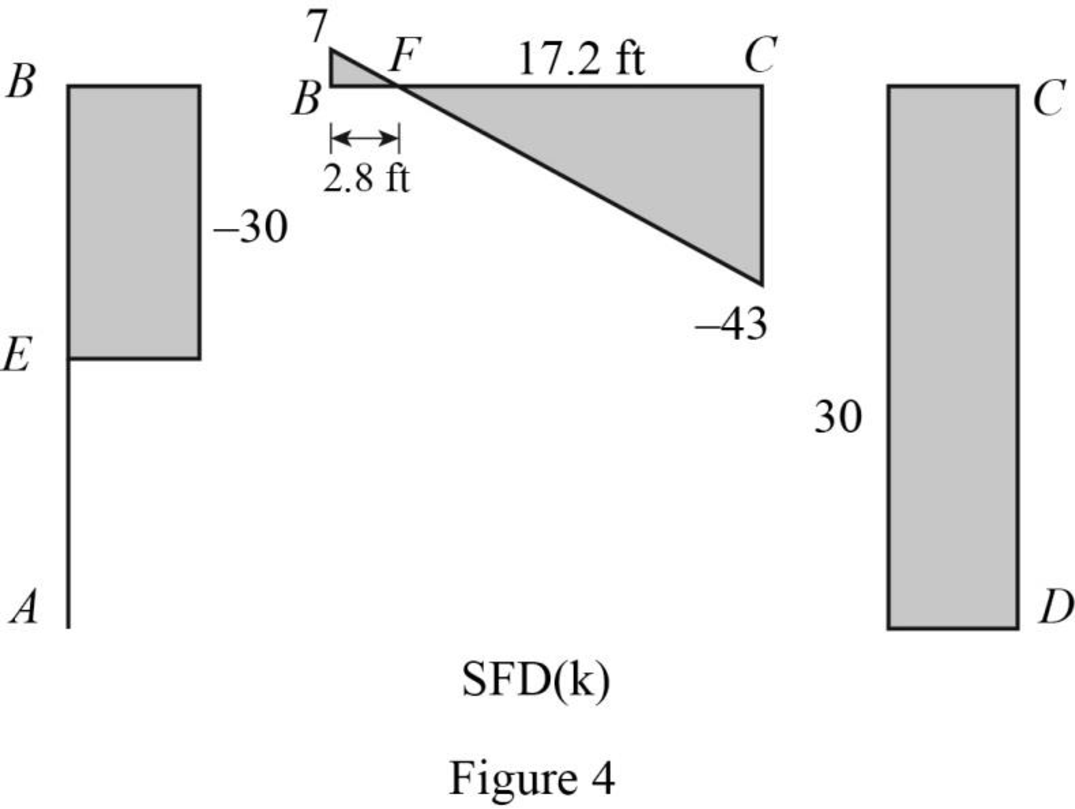
Refer to the shear force diagram, the maximum bending moment occurs at point F where the shear force changes sign.
Use similar triangle concept for the region BC:
Plot the shear force diagram as in Figure 4.
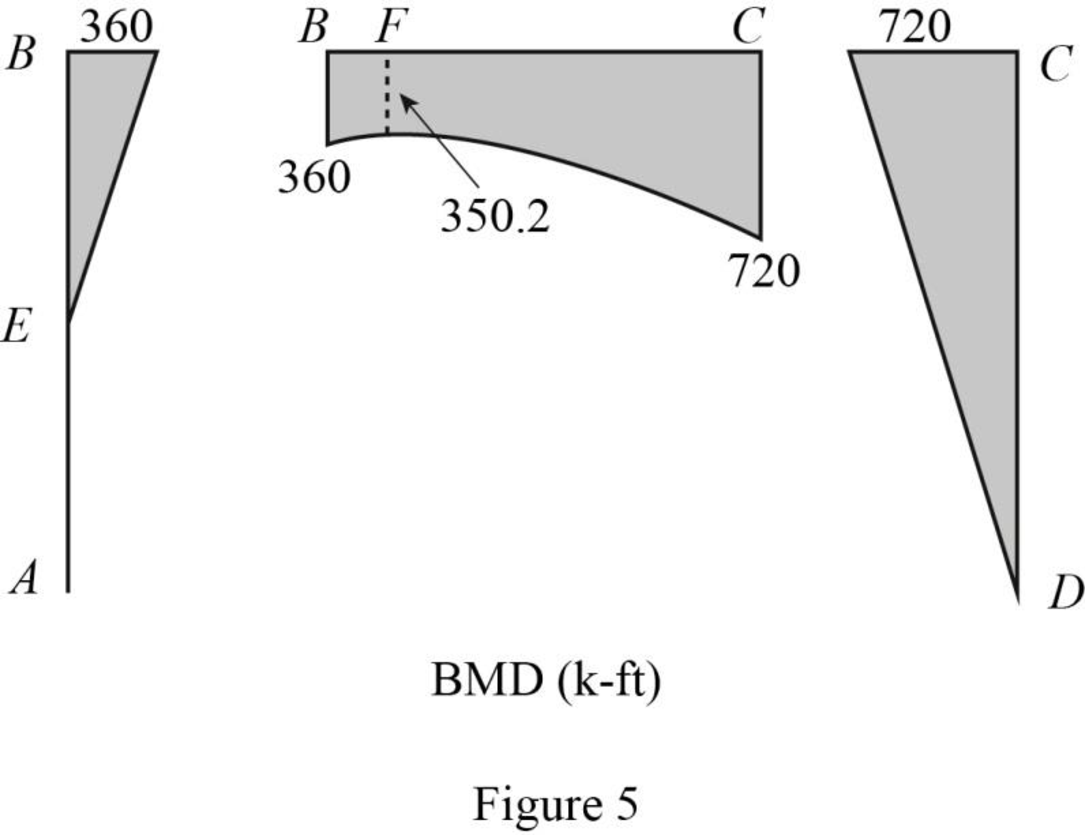
Find the bending moment at point F.
Plot the bending moment diagram as in Figure 5.
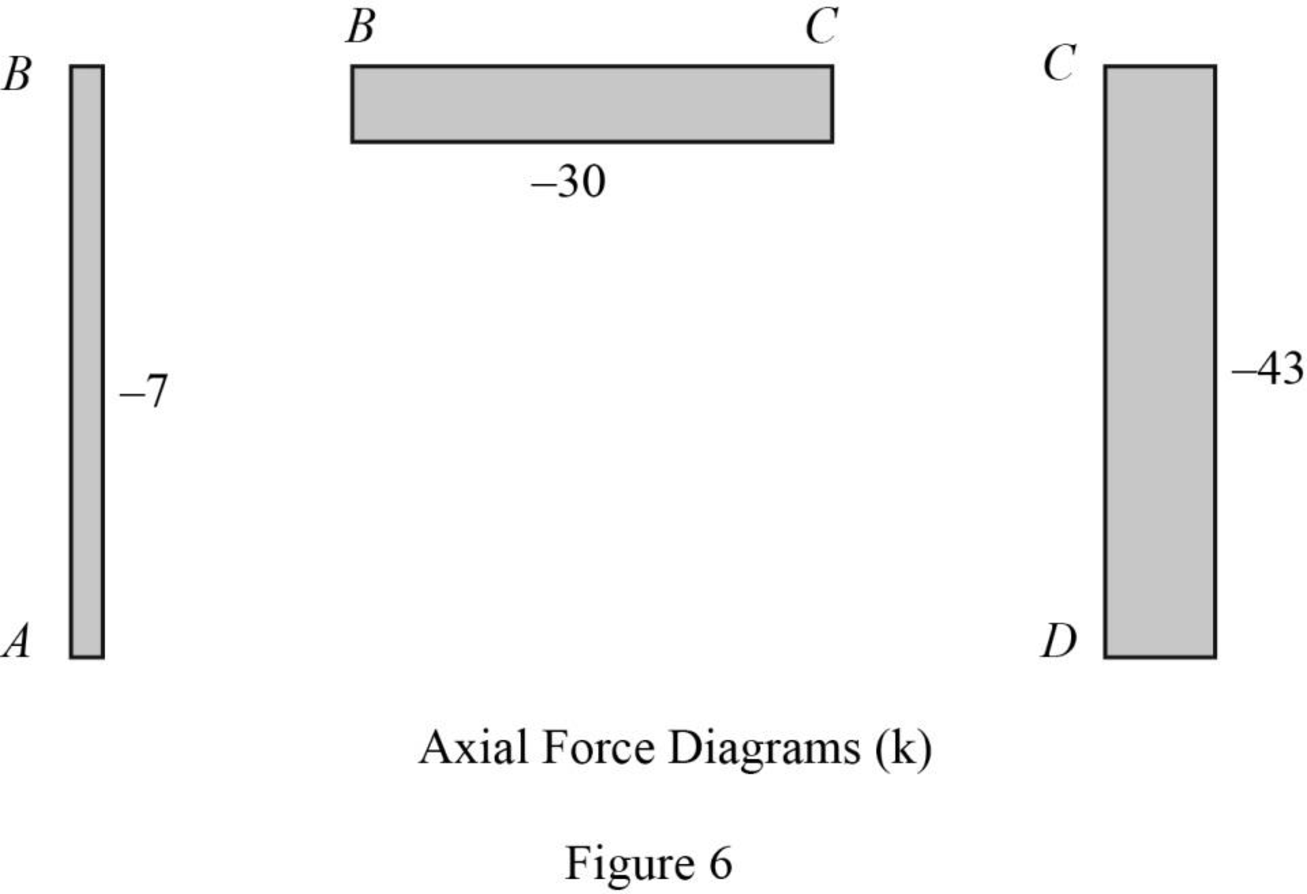
Plot the axial force diagram as in Figure 6.
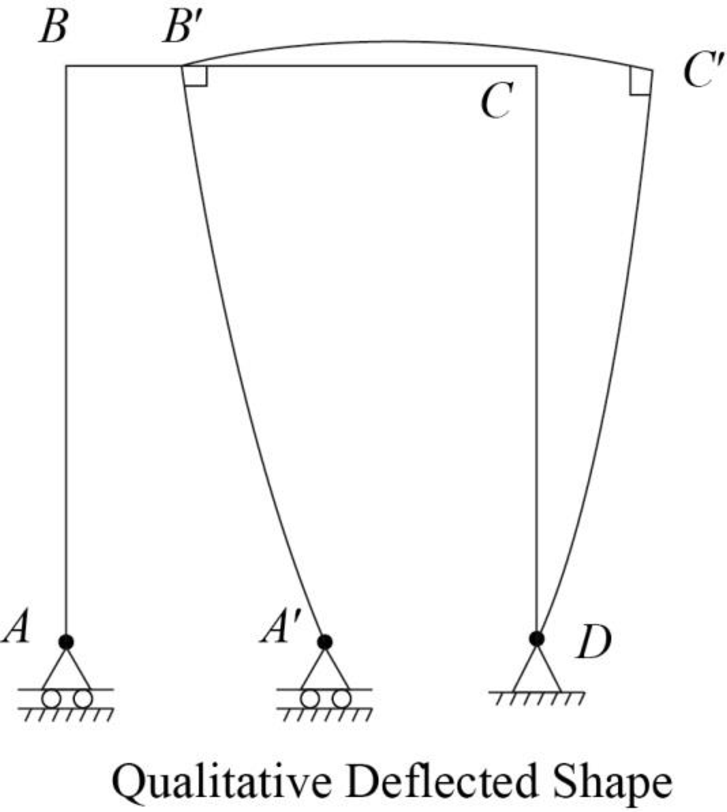
Plot the qualitative deflected shape as in Figure 7.
Want to see more full solutions like this?
Chapter 5 Solutions
Structural Analysis (MindTap Course List)


- Two W14x38 tension members are connected with a splice connection using plates attached atthe top and the bottom flanges. The design axial load Pu is 320 kips. The bolts are made of A325X, and thebolt diameter is ½ inch. (Slip-Critical connection)( LRFD units)arrow_forwardA tension member made of L4x4x1/2 is connected to gusset plate with welds. Using E70electrode and ½ inch weld size, design the balanced weld lengths.( Use AISC manual, LRFD units)arrow_forward= A steel pile (H-section; HP 310 x 125; and so A, 15.9 x 10⁻³ m² ) is driven into a layer of sandstone. The length of the pile is 25 m. Following are the properties of the sandstone: unconfined compression strength = qu(lab) = 78 MN/m² and angle of friction = 36°. Using a factor of safety of 3, estimate the allowable point load that can be carried by the pile. Use [qu(d Qu(lab). qu(design) b)/5]. (Enter your answer to three significant figures.) Qp(all) kNarrow_forward
- Си A concrete pile 20 m long having a cross section of 0.25 m x 0.25 m is fully embedded in a saturated clay layer. For the clay, given: Ysat = 18 kN/m³, = 0, and c₁ = 80 kN/m². Determine the allowable load that the pile can carry (FS-3). Use the A method to estimate the skin resistance. For L = 20 m, A = 0.173. (Enter your answer to three significant figures.) Qall kNarrow_forwardA concrete pile 65 ft long having a cross section of 15 in. × 15 in. is fully embedded in a saturated clay layer for which Ysat = can carry. (Let FS = 3.) Use the a method equation QsfpAL = ac₂pAL and the following table to estimate the skin friction and Vesic's method for point load estimation. Си α Pa ≤ 0.1 1.00 0.2 0.3 0.92 0.82 0.4 0.74 0.6 0.62 0.8 0.54 1.0 0.48 1.2 0.42 1.4 0.40 1.6 0.38 1.8 0.36 2.0 0.35 2.4 0.34 2.8 0.34 Note: atmospheric pressure pa ≈ 100 kN/m² or 2000 lb/ft². (Enter your answer to three significant figures.) Qall = kip 121 lb/ft³, = 0, and Cu = 1600 lb/ft². Determine the allowable load that the pilearrow_forwardA tension member made of L4x4x1/2 is connected to gusset plate with welds. Using E70electrode and ½ inch weld size, design the balanced weld lengths.( Use AISC manual, LRFD units)arrow_forward
- Using the ultimate strength method, determine the maximum load, Pu, that the welded connectioncan carry. Weld size is ½ inch. The structural members are made of grade 50 steel. (Use AISC manual, LRFD units)arrow_forward21:52 | 2.3Kb.s ← CamScanner ۲۰۲۵-۰۴... هوا 8:05: ان 4.5G 443% به نام خدا تمرینات درس مکانیک سیالات سری دوم - حامد سرکرده 0.3m A 0.3m 0.6m روغن B $ 09 آب lm P=13.74kpa gage PA هوا 4.6m سال 0.3m 50mm Pc 13.72kpa gage EL = 50 EL = 30 ۱ در شکل رو به رو فشار در نقاط A, B, C,D بر حسب پاسکال چقدر است؟ فشار P چقدر است چگالی روغن ۰/۸ میباشد در داخل مخزن استوانه ای رو به رو که محتوی نفت به چگالی ۰/۸ میباشد مخزن استوانه ای آبی قرار گرفته است. مقدار P فشار نسبی در فشارسنج (A) و ارتفاع h چقدر است. ۴- لوله های A و B که حاوی آب در فشارهای ۲/۷۶ و ۱/۳۸ بار به ترتیب هستند اختلاف ارتفاع جیوه در مانومتر نشان داده شده در شکل چقدر است؟ چگالی جیوه ۱۳/۵۷ در نظر گرفته شود. Scanned with CamScannerarrow_forwardh EL = 50 EL = 30arrow_forward
- h EL = 50 EL = 30arrow_forwardCalculate the instantaneous deflections and the long term-term deflections after 15 years for the flat roofbeam shown below (simply supported). Use fy = 60,000 psi, fc′ = 4000 psi, and assume that the uniformdead load value shown does not include beam weight, and that none of the concentrated live loads aresustained. The concrete weight is 135 pcf. Investigate the deflection acceptability of the beam accordingto the ACI Code.arrow_forwarda) Determine the global stiffness matrix of the beam shown in Figure below. Assume supports at 1 and 3 are rollers and the support at 2 is a pinned support. Indicate the degrees-of freedom in all the stiffness matrices. EI is constant. Use the values of w and L1 as 50 kN/m and 1.75m, respectively. Note, L2=3L1. b) Determine the rotations at all the nodes of the beam and reactions at the supports. Show all calculations. c) Draw the BMD of the beam on the compression side showing the salient values. What are the maximum bending moments of the beam? Draw the deflected shape of the beam.arrow_forward
