Concept explainers
Plot the shear diagram, bending moment diagram, axial force diagram, and the qualitative deflected shape of the frame.
Explanation of Solution
Write the condition for static instability, determinacy and indeterminacy of plane frames as follows:
Here, number of members is m, number of external reactions is r, the number of joints is j, and the number of elastic hinges is
Find the degree of static indeterminacy (i) using the equation;
Refer to the Figure in the question;
The number of members (m) is 3.
The number of external reactions (r) is 3.
The number of joints (j) is 4.
The number of elastic hinges
Substitute the values in Equation (2);
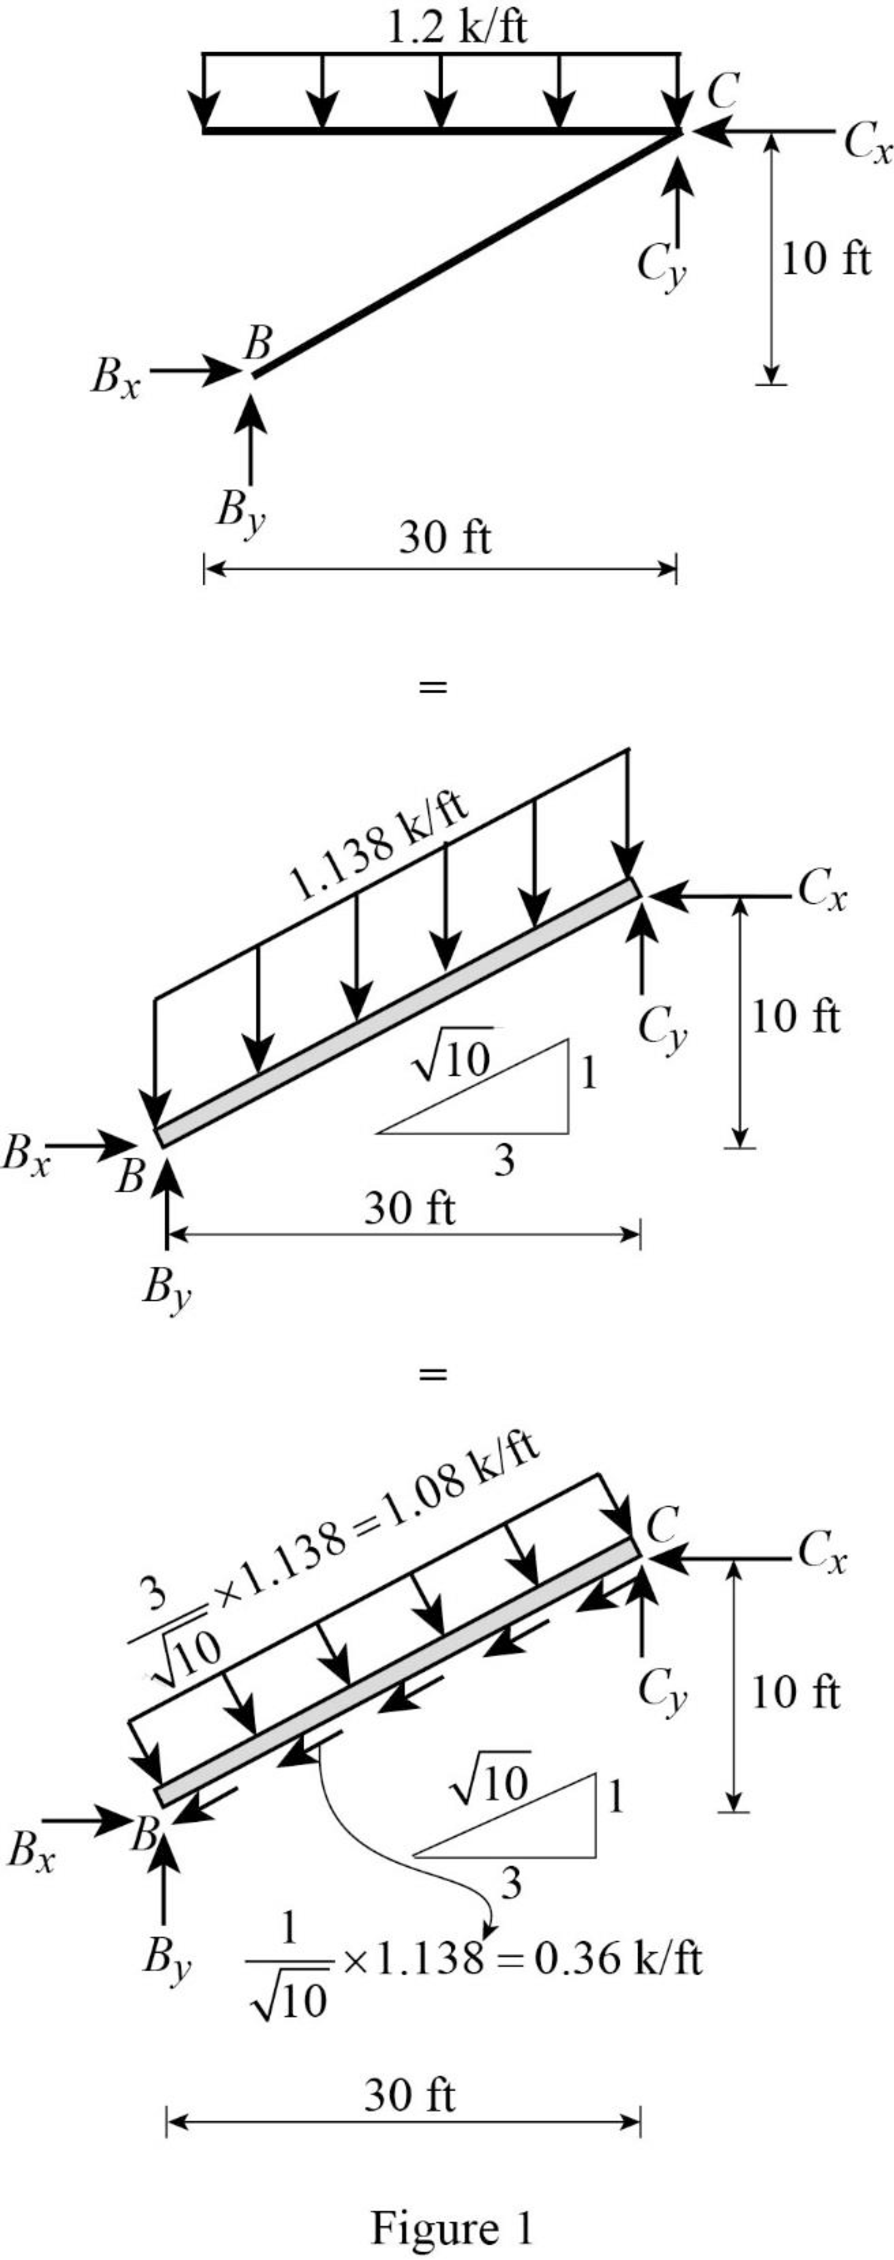
Show the equivalence of uniformly distributed load as in Figure 1.
Show the free-body diagram of the entire frame as in Figure 2.
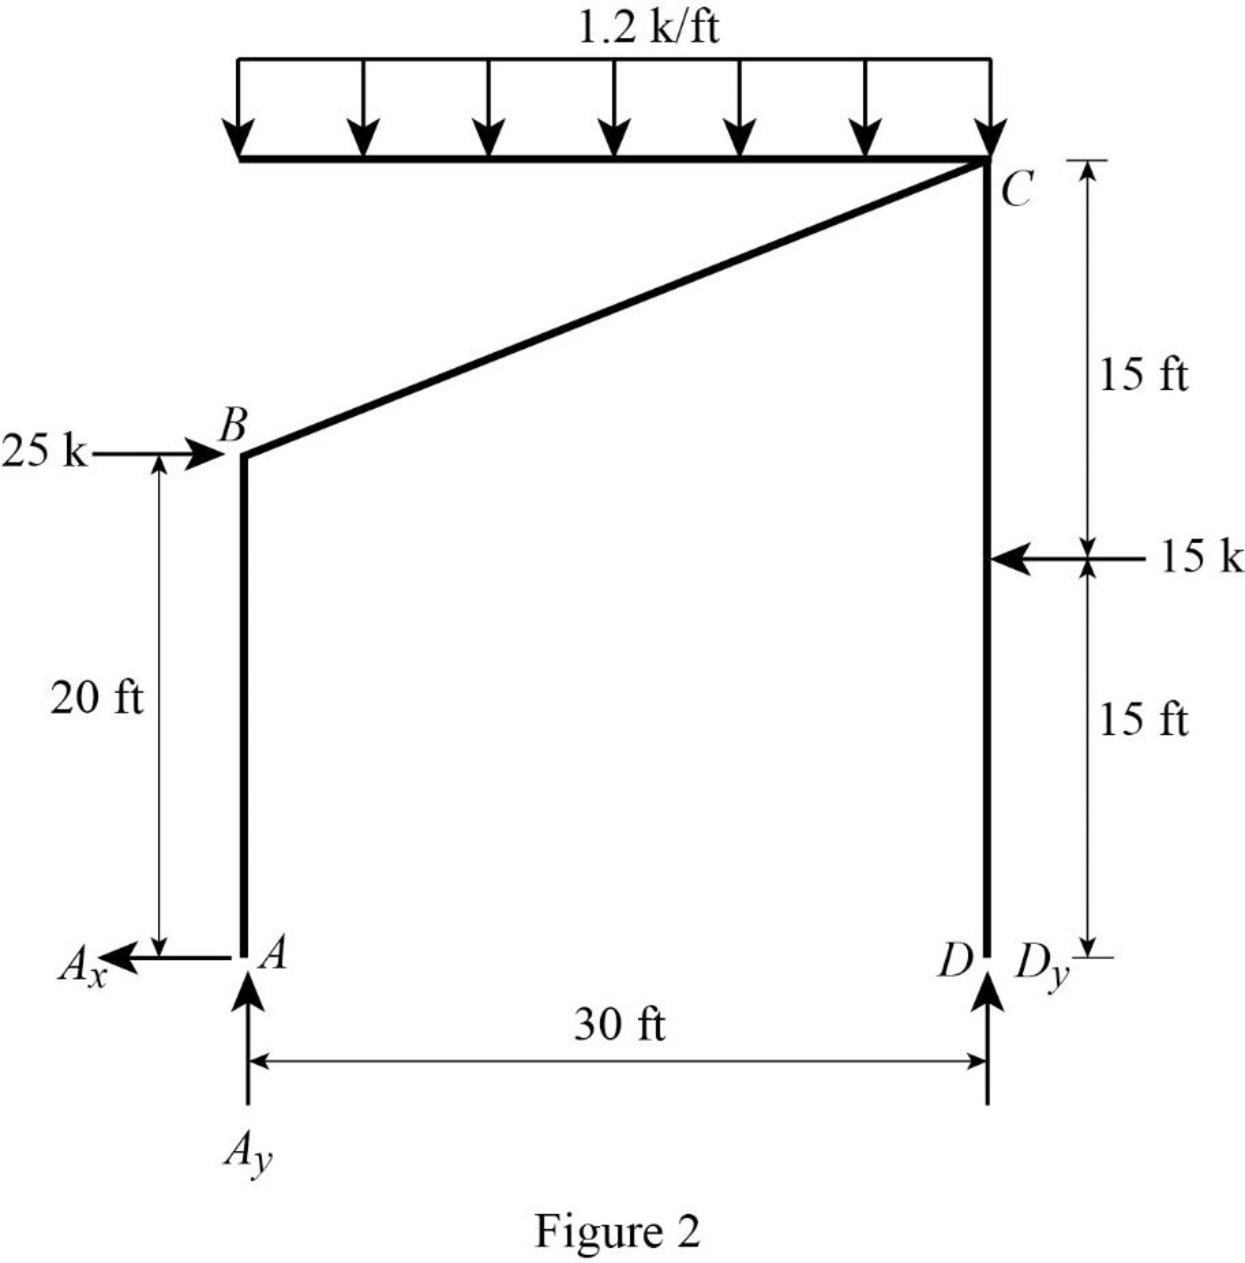
Find the horizontal reaction at point A by resolving the horizontal component of forces.
Find the vertical reaction at point D by taking moment about point A.
Find the vertical reaction at point A by resolving the vertical component of forces.
Show the free-body diagram of the members and joints of the entire frame as in Figure 3.
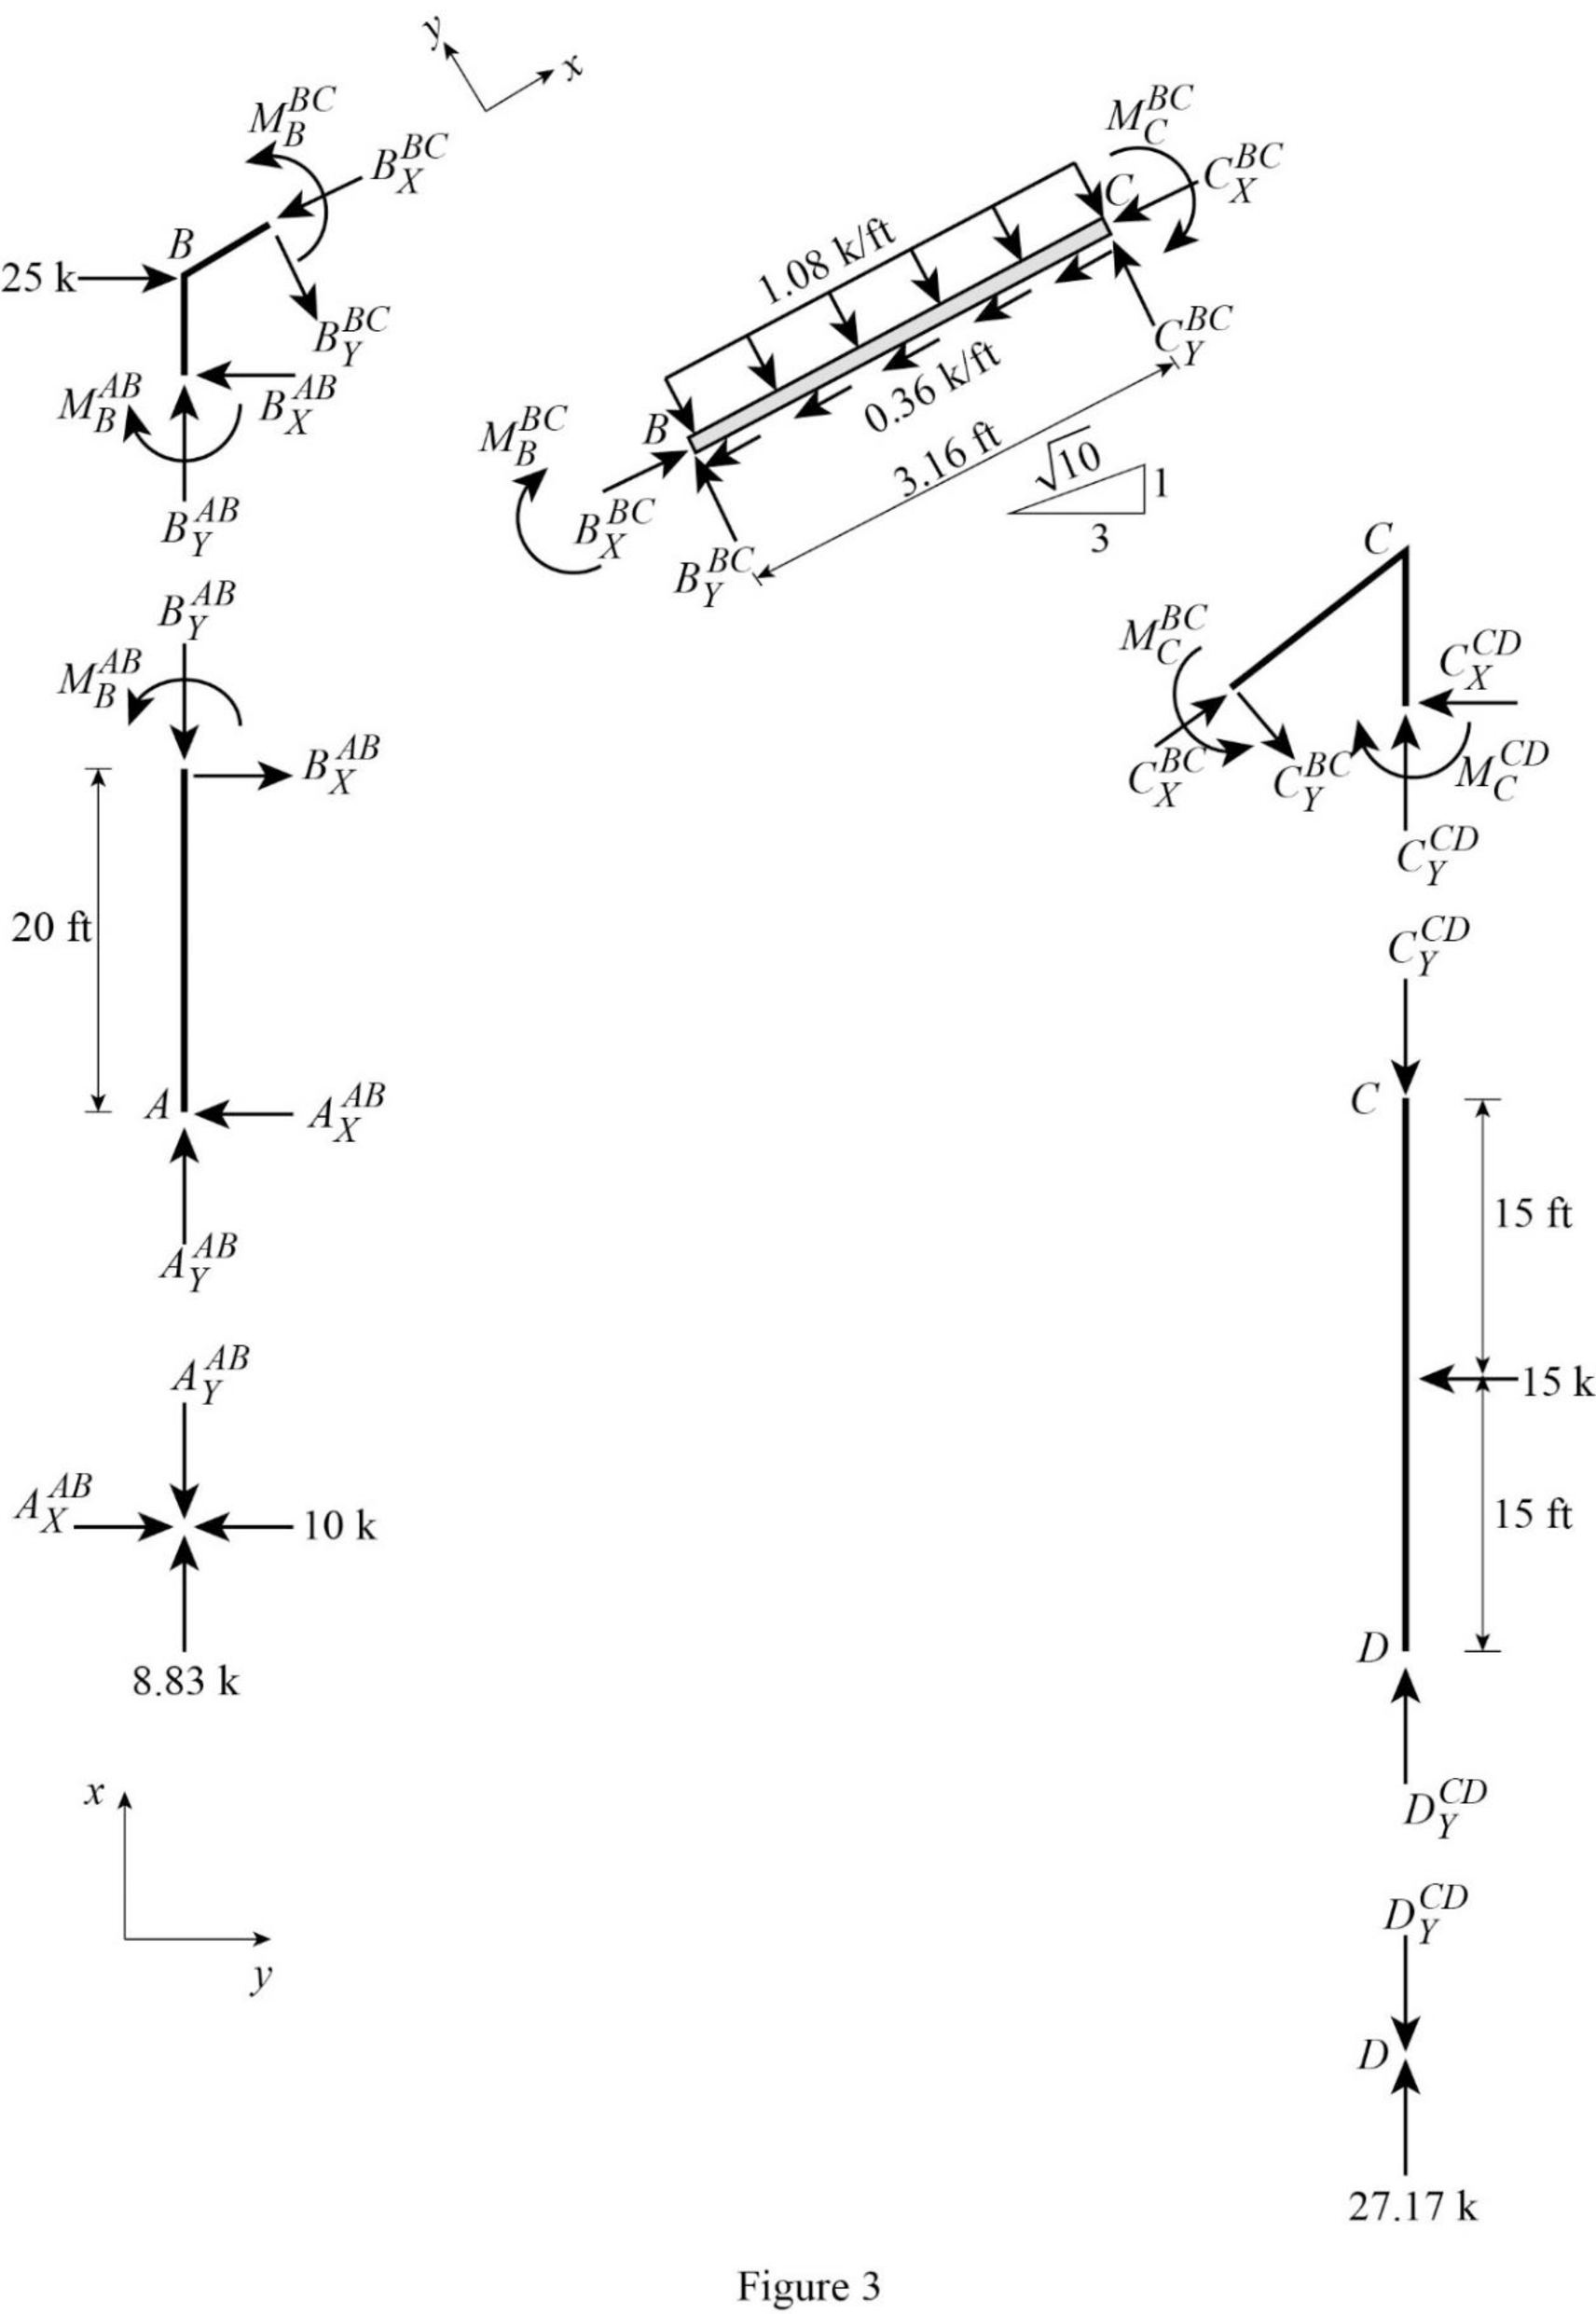
Consider point A:
Resolve the vertical component of forces.
Resolve the horizontal component of forces.
Consider the member AB:
Resolve the vertical component of forces.
Take moment about the point B.
Consider the point D:
Resolve the vertical component of forces.
Consider the member CD:
Resolve the vertical component of forces.
Take moment about the point C.
Resolve the horizontal component of forces.
Consider the point C:
Resolve the vertical component of forces.
Resolve the horizontal component of forces.
Take moment about the point C.
Consider the section BC:
Resolve the vertical component of forces.
Resolve the horizontal component of forces.
Take moment about point B:
Plot the moment end forces of the frame as in Figure 4.
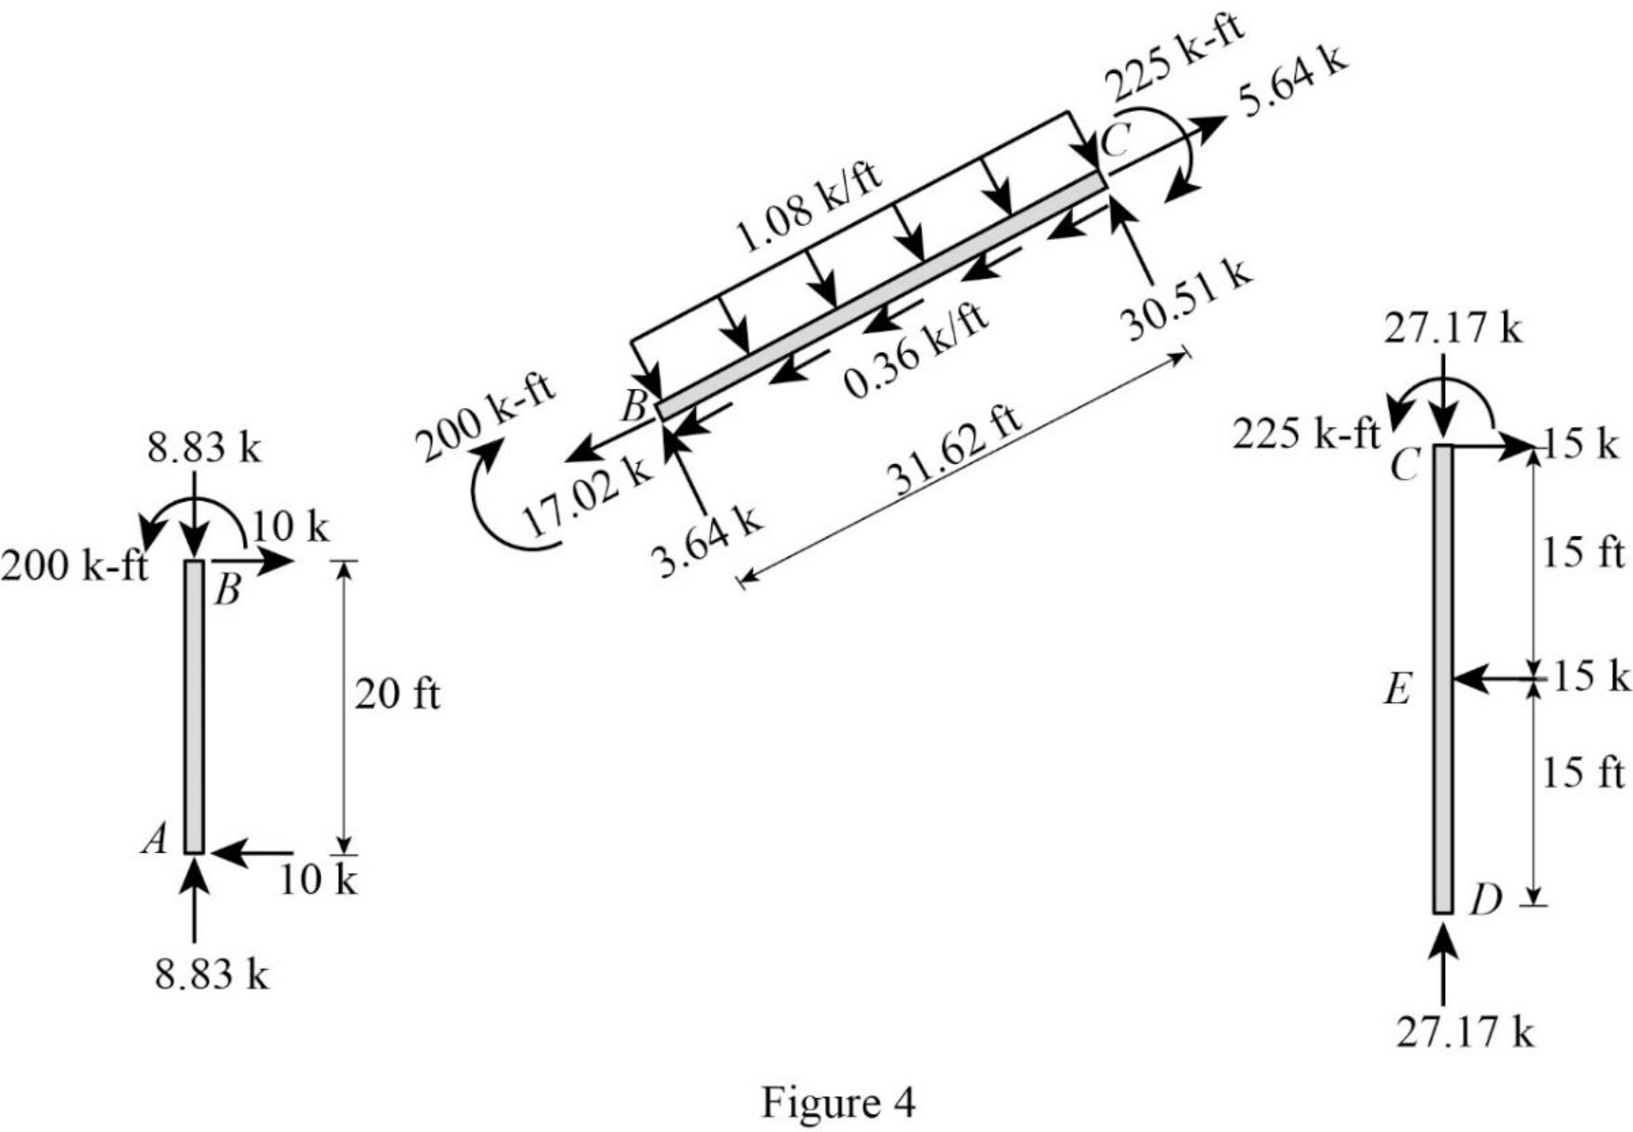
Refer to the moment end force diagram plot the shear diagram, bending moment diagram, and the axial force diagrams.
Plot the shear force diagram as in Figure 5.
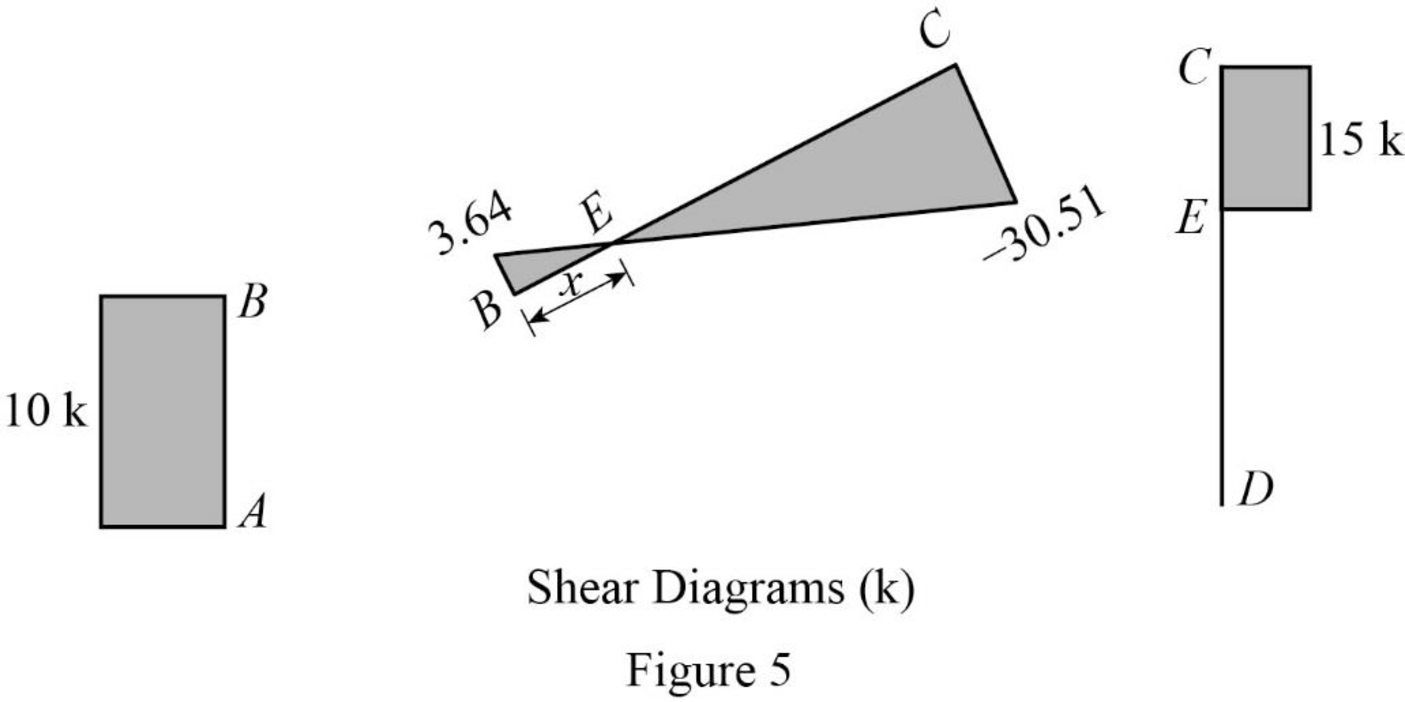
The maximum bending moment occurs where the shear force changes sign.
Consider the section BEC, use the similar triangle concept.
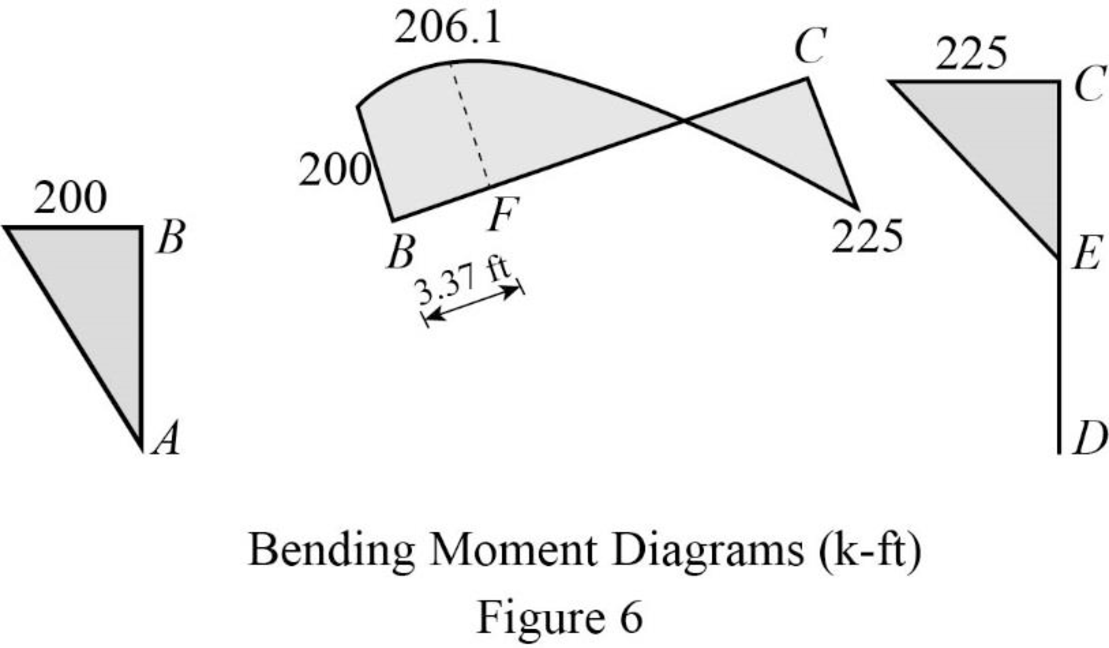
Plot the bending moment diagram as in Figure 6.
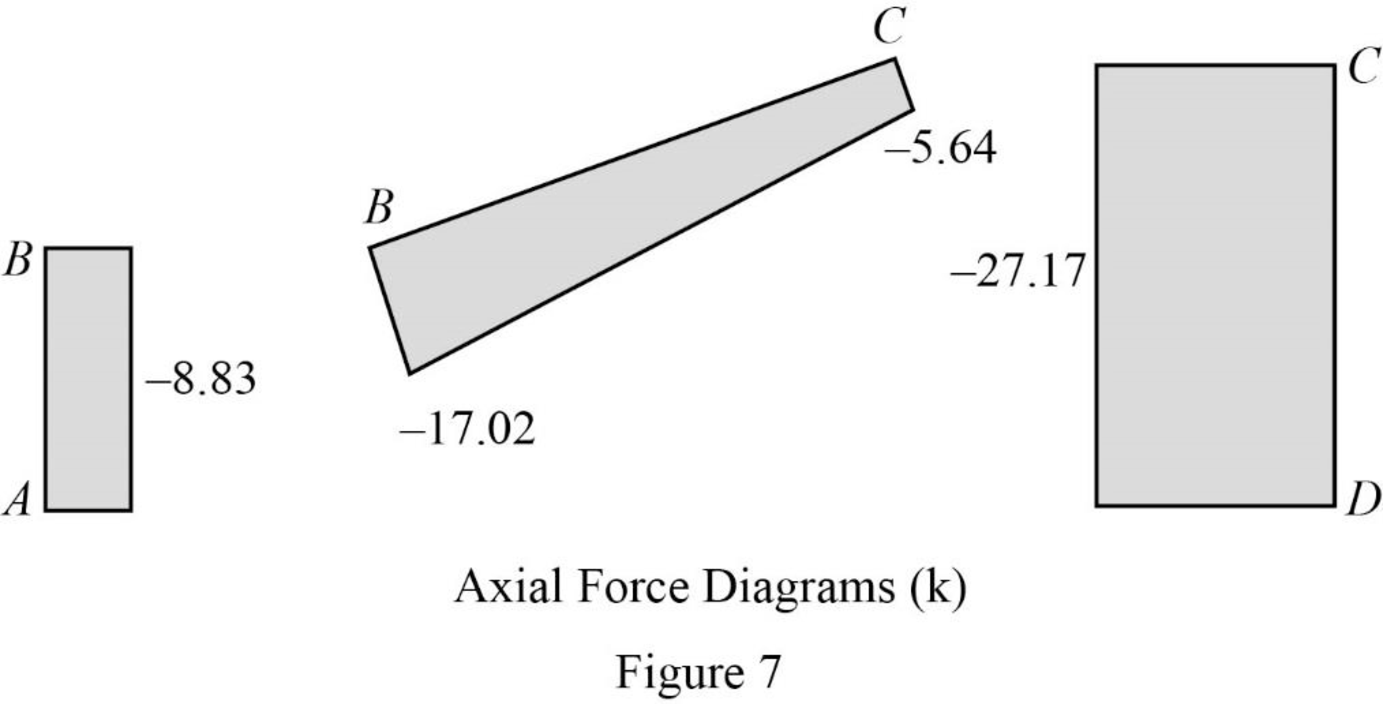
Plot the axial force diagram as in Figure 7.
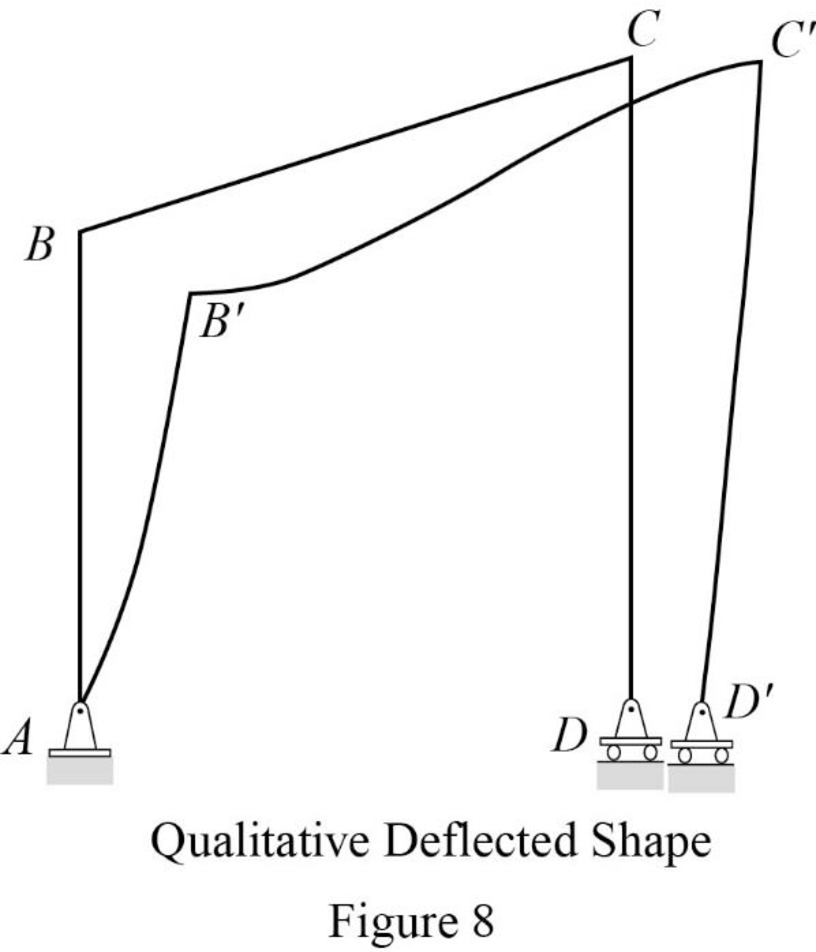
Plot the qualitative deflected shape as in Figure 8.
Want to see more full solutions like this?
Chapter 5 Solutions
Structural Analysis, Si Edition


- Problems 5-1 Stead flow of steam enters a condenser with an enthalpy of 2400 kJ/kg and a velocity of 366 m/sec. the condensate leaves the condenser with an enthalpy of 162kJ/sec and a velocity of 6 m/sec what is the heat transferred to the cooling water per kg steam condensed. (-69198 kJ/kg) 5-2 An air compressor delivers 4.5 kg of air per minute at a pressure of 7 bar and a specific volume of 0.17 m³ /kg. Ambient conditions are pressure 1bar and specific volume 0.86 m³/kg. The initial and final internal energy values for the air are 28 kJ/kg and 110 kJ/kg respectively. Heat rejected to the cooling jacket is 76kJ/kg of air pumped. Neglecting changes in kinetic and potential energies, what is the shaft power required driving the compressor? (14.3kW)arrow_forwardDetermine the design resistance to transverse force F,Rdarrow_forwardAs a structural engineer, your task is to design an optimum section that has sufficient resistance to the applied loading for the primary beam proposed in Figure 1. A UB in grade S275 steel is required for the unrestraint beam to carry the ultimate loads over the given span. Choose an optimumUB section and justify your selection. You are required to submit a design analysis by considering bending, shear, transverse force, and deflection checking for the selected member based on Eurocode 3 and the assumption of support condition and loading must be clearly stated. P=15 kN. a 2 m. b=3m ·L· ·b. Figure 1 Simply supported steel beamarrow_forward
- Why is it important to establish logical relationships between tasks when developing a construction schedule?arrow_forwardFor the gravity concrete dam shown in the figure, the following data are available: - Unit weight of concrete (Yeone) = 2.4 ton/m³ Neglect( Wave pressure, silt pressure, ice force and earth quake force) -0.65, (Ywater) 1 ton/m³ Find factor of safety against sliding and overturning (F.Said & F.Sover), If heel and toe stresses (Pais & Pmas) are 57.17ton/m2 and 84.53 ton/m² respectively. w.s.l 83m 10m 80m 8m Solve on paper step by step with sketcharrow_forwardWhy is proper planning important when developing a baseline construction project schedule?arrow_forward
- Determine the minimum possible surface area of a secondary clarifier treating activated sludge with a design influent flow rate (Q) of 1,000 m³/d, a return activated sludge (RAS) recycling ratio of 25%, and a mixed liquor total suspended solids (MLSS) concentration of 4,000 mg/L, if the overflow rate must be less than 33 m/d and the solids loading rate must be less than 250 kg/m²/d. Express your answer in m² and round up to the next integer.arrow_forwardEstimate the required air flow rate for the new activated sludge plant at Pea Ridge (Problems 23-223-723-10, and 23-13). The flow rate is 8,450 m³/day, the concentration of bCOD going into the system (So) is 137 mg/L, the concentration of bCOD leaving the system (S) is 16.3 mg/L, and the mass of cells produced per day (Pxvss) is 277.4 kg/d. Use the following assumptions to estimate the required air flow rate: . Clean water correction, a = 0.50 . Salinity correction, B = 0.95 Fouling factor = 0.9 Wastewater temperature = 12°C Atmospheric pressure = 101.325 kPa .Elevation 500 m . Depth of aerator = 5.6 m Operating DO 2.0 mg/L Percent oxygen leaving aeration tank - 19% ■ Manufacturer's SOTR = 535 kg/d Manufacturer's air flow rate at standard conditions 50 m³/d - aerator Express your answer with the units of m³/d and round to the nearest integer.arrow_forwardDetermine the required solids retention time (SRT) of a completely mixed activated sludge aeration tank for a conventional activated sludge system treating a design flow rate of 34,560 m³/d, where the effluent standards are 30.0 mg/L for BODs and 30.0 mg/L for total suspended solids (TSS). Assume that the BOD5 of the effluent TSS is 70% of the TSS concentration. Assume the BODs concentration leaving the primary clarifier is 128 mg/L that the MLVSS concentration (X₂) is 2,500 mg/L. Assume the following values for the growth constants: Ks 100 mg/L BODS ⚫ Hm - 2.5 d 1 kd = 0.050 d 1 Y = 0.50 mg VSS/mg BODs removed Express your answer in days and round to the nearest 0.1.arrow_forward
- Q1: Figure below shows loaded beam with its cross-section area, (A) Draw shear force and bending moment diagrams, stating the main values, (B) Find central slope and deflection, (C) Sketch the distribution of shear stress at left support, (D) Find maximum tensile and compressive bending stresses set up in beam at right support. E-205GN/m² P1 P2 P3 W1 W2 Lin Lin # A Length in (m) and loads in kN 3a a 2a 2a (Cross-section area, All dimensions in (mm))arrow_forwardEstimate the mass of oxygen to be supplied for a new activated sludge plant at Pea Ridge to treat a flow rate of 8,450 m³/day. Assume that the concentration of bCOD going into the system (So) is 137 mg/L, that the bCOD leaving the system (S) is 16.3 mg/L, and that the mass of cells produced per day (Pxvss) is 277.4 kg/d. Express your answer in kg/day and round to the nearest integer.arrow_forward*10-4. Determine the internal moments at the supports A, B, and C, then draw the moment diagram. Assume A is pinned, and B and C are rollers. El is constant. 3 k/ft 8 ft- 8 ft -4 ft-arrow_forward
