Concept explainers
Plot the shear diagram, bending moment diagram, axial force diagram, and the qualitative deflected shape of the frame.
Explanation of Solution
Write the condition for static instability, determinacy and indeterminacy of plane frames as follows:
Here, number of members is m, number of external reactions is r, the number of joints is j, and the number of elastic hinges is
Find the degree of static indeterminacy (i) using the equation;
Refer to the Figure in the question;
The number of members (m) is 2.
The number of external reactions (r) is 3.
The number of joints (j) is 3.
The number of elastic hinges
Substitute the values in Equation (2);
Show the free-body diagram of the entire frame as in Figure 1.
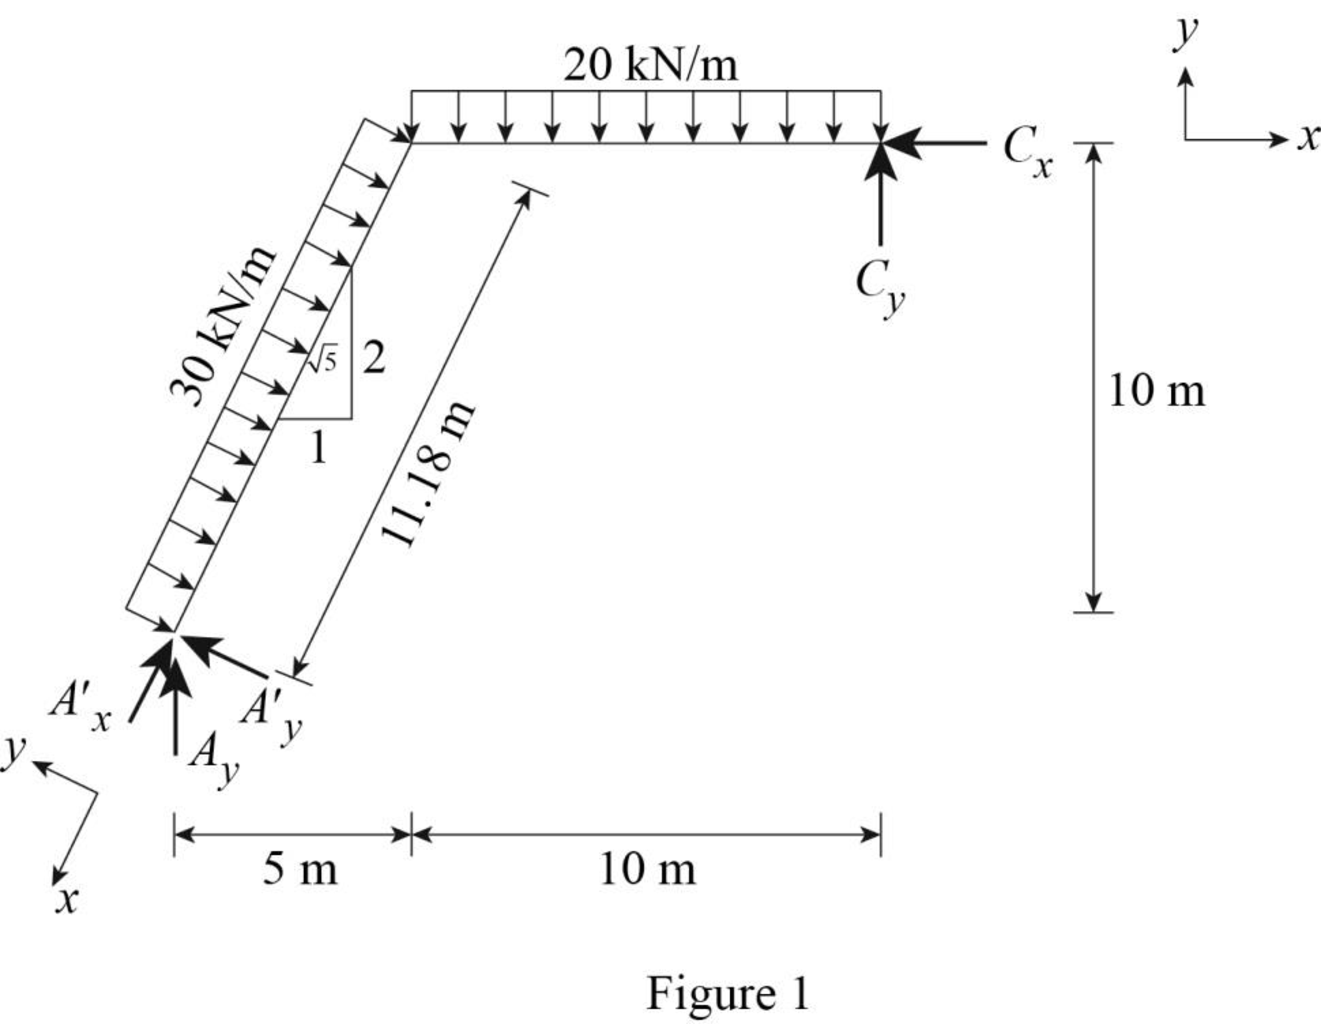
Refer Figure (1).
Find the distance for the beam AB.
Find the horizontal reaction at point C by resolving the horizontal component of forces.
Find the resultant reaction at point C by taking moment about point A.
Find the vertical reaction at point A by resolving the vertical component of forces.
Consider point A:
Resolve the vertical component of forces.
Resolve the horizontal component of forces.
Show the free-body diagram of the members and joints of the entire frame as in Figure 2.
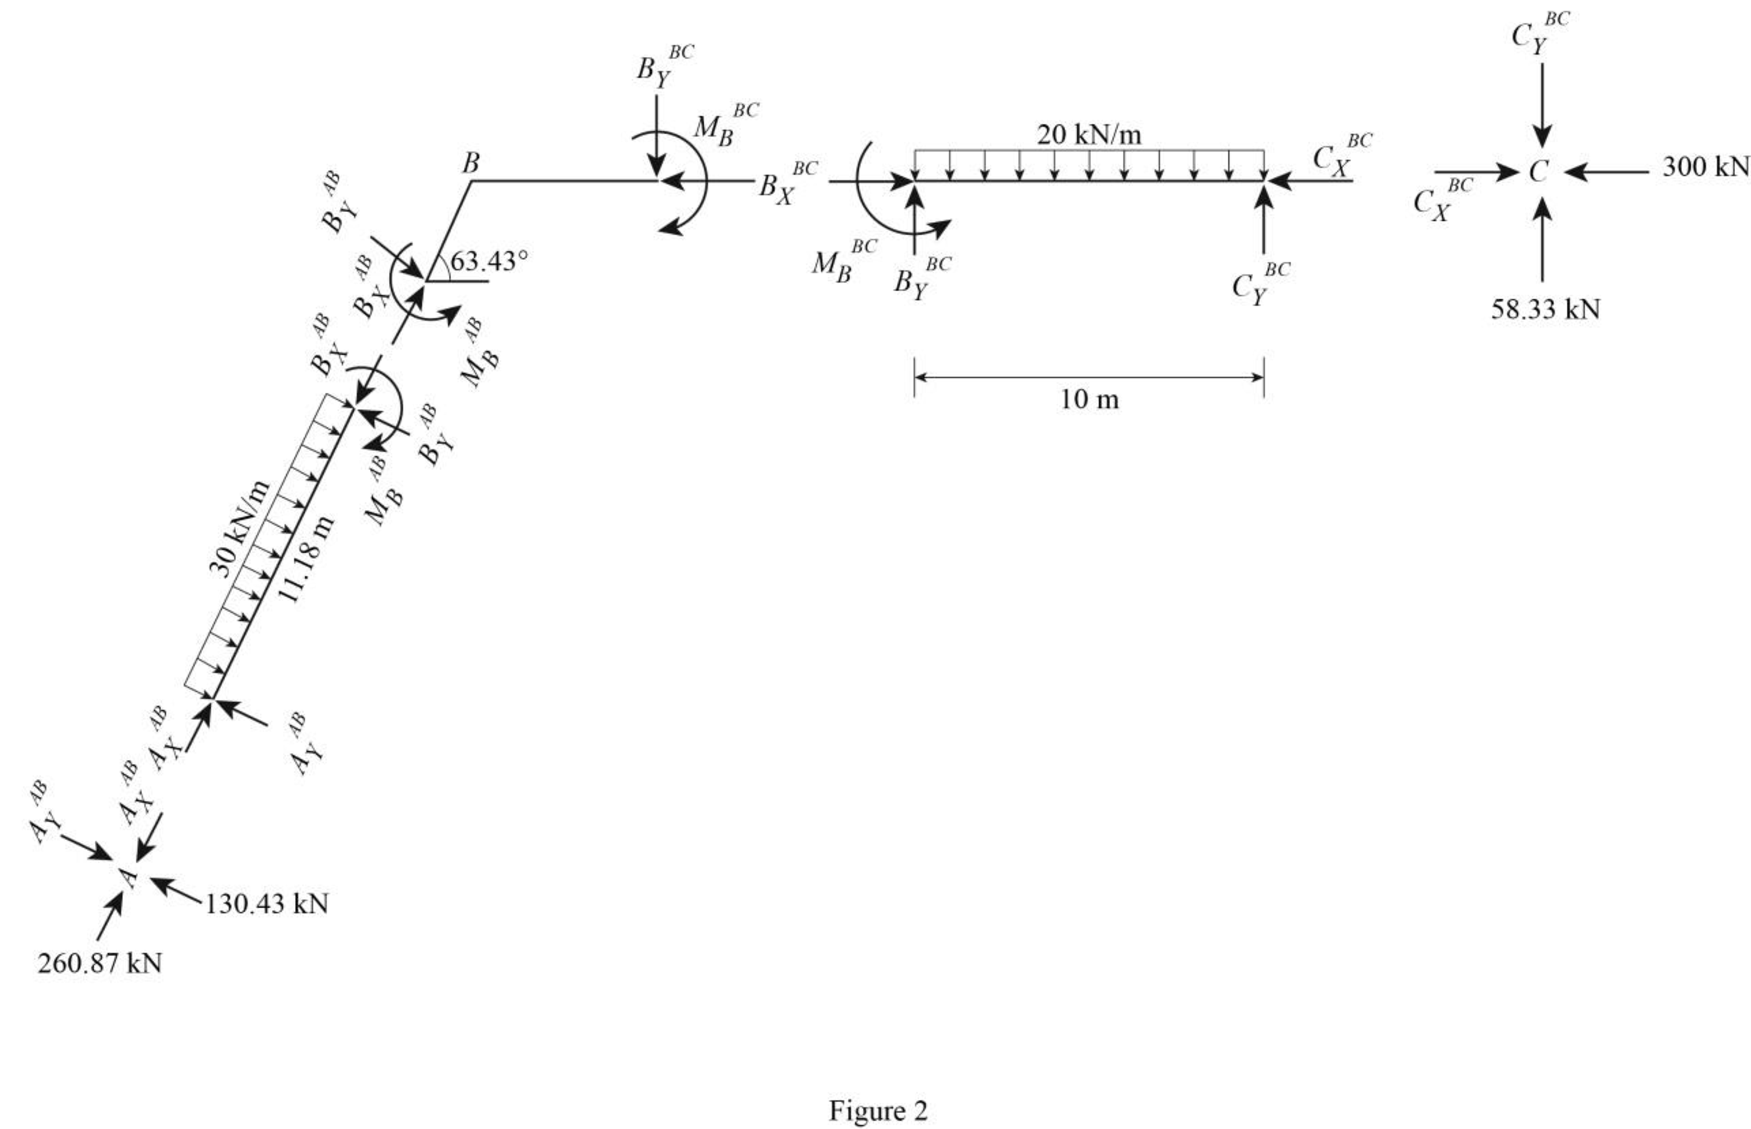
Consider point A:
Resolve the vertical component of forces.
Resolve the horizontal component of forces.
Consider the member AB:
Resolve the vertical component of forces.
Resolve the horizontal component of forces.
Take moment about the point B.
Consider the point C:
Resolve the vertical component of forces.
Resolve the horizontal component of forces.
Consider the member BC:
Resolve the vertical component of forces.
Resolve the horizontal component of forces.
Take moment about point B:
Plot the moment end forces of the frame as in Figure 3.
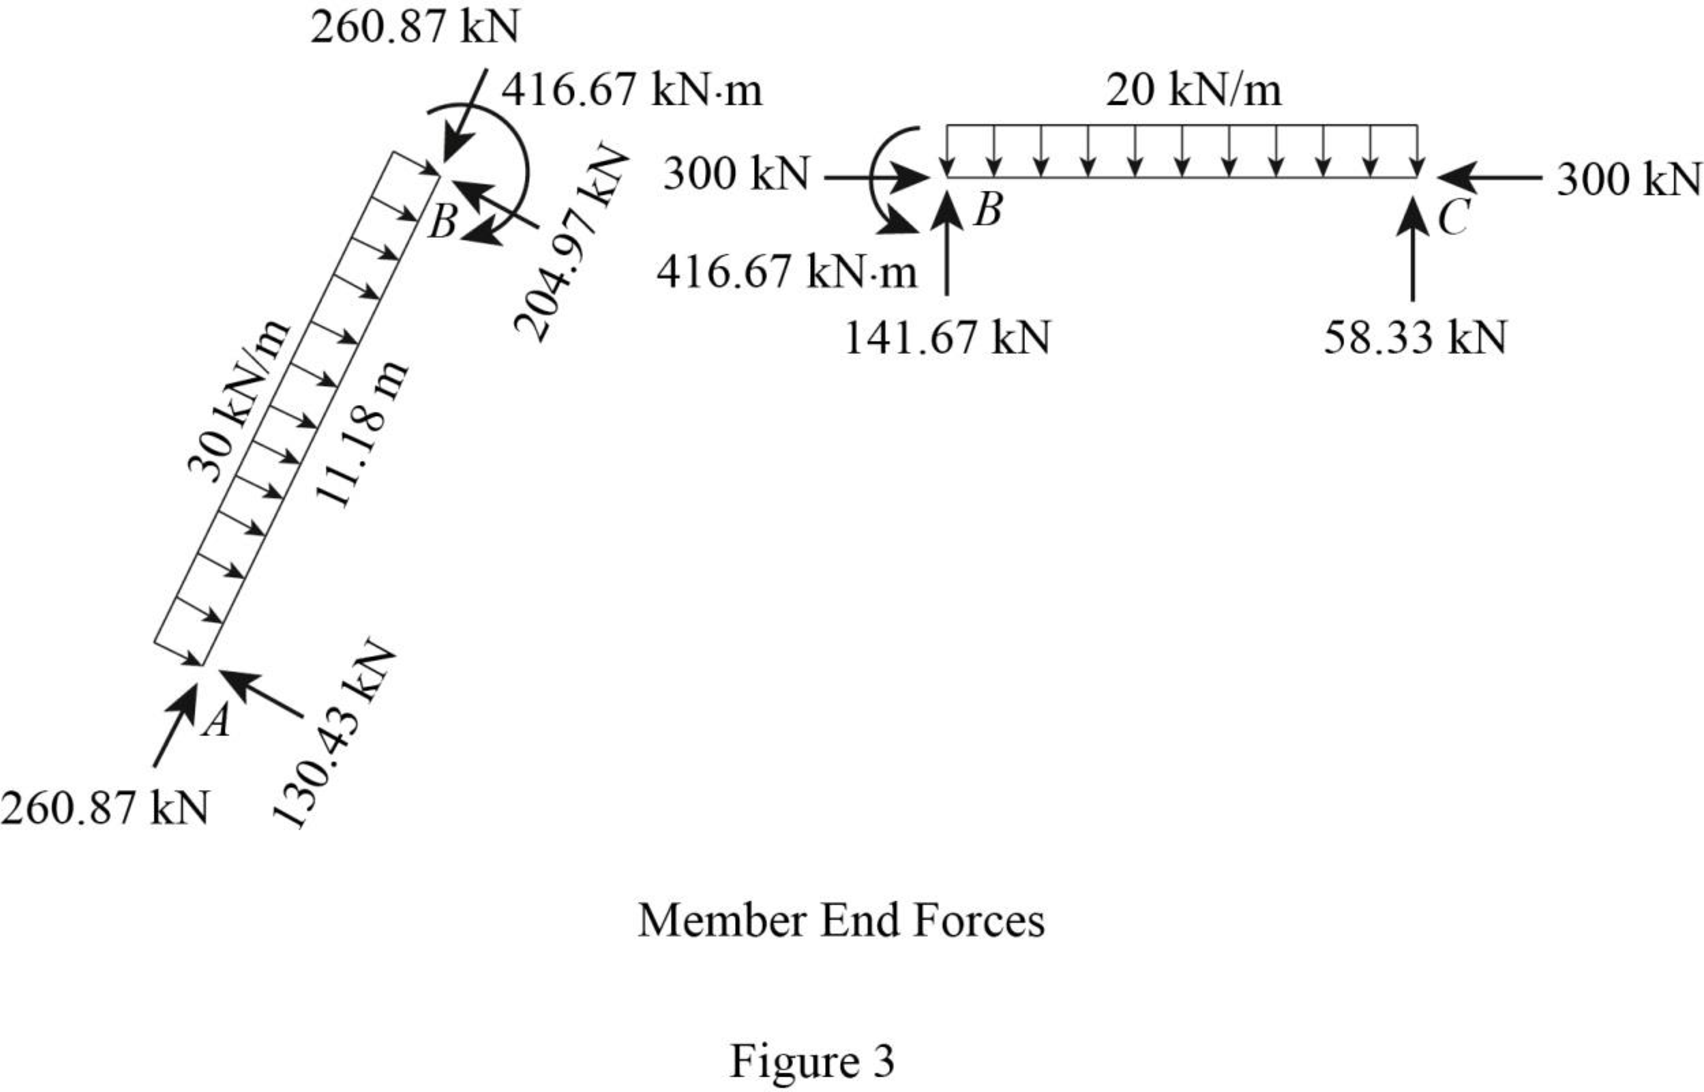
Refer to the moment end force diagram plot the shear diagram, bending moment diagram, and the axial force diagrams.
Plot the shear force diagram as in Figure 4.
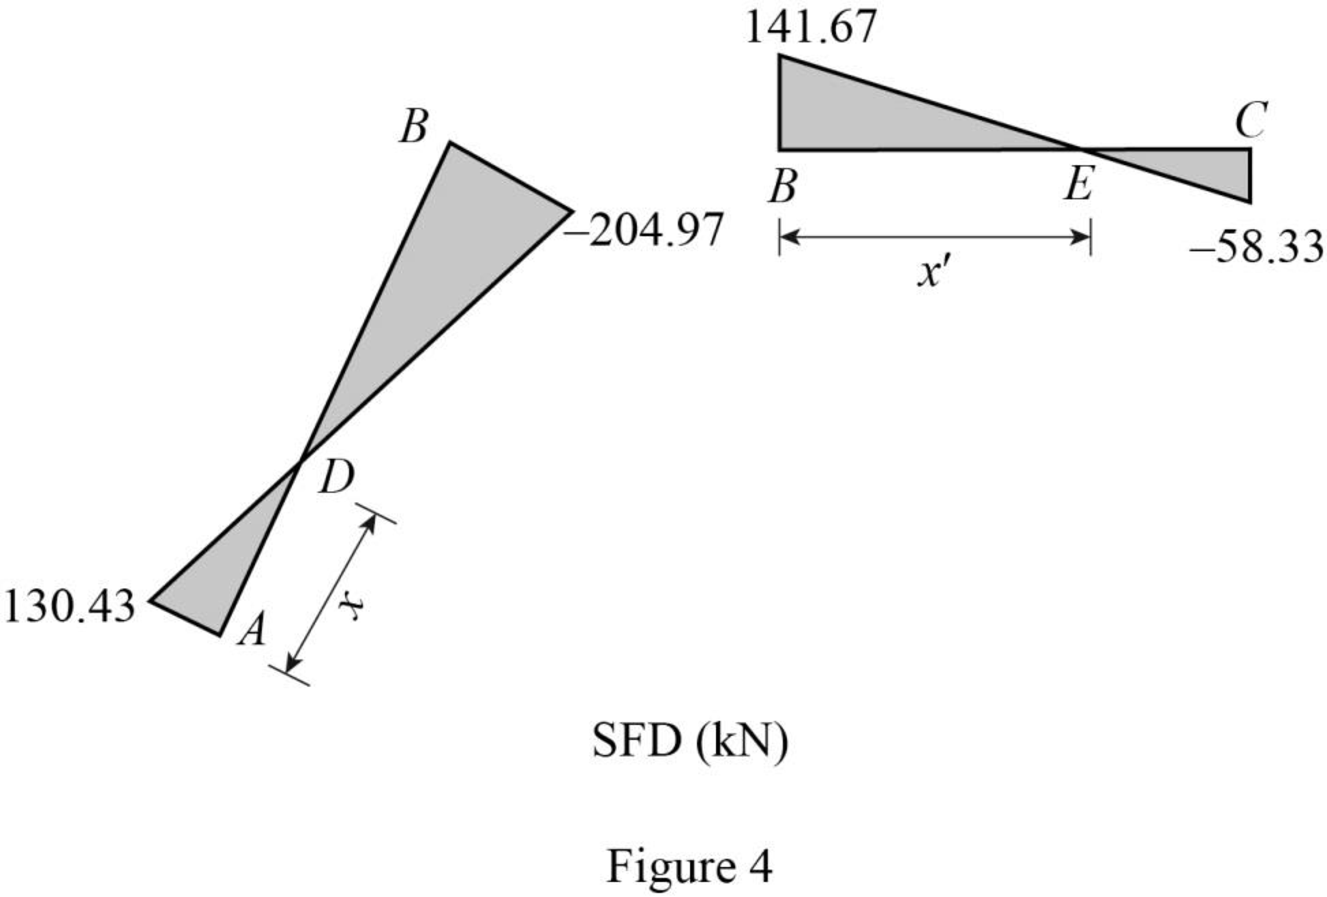
The maximum bending moment occurs where the shear force changes sign.
Consider the section ADB, use the similar triangle concept.
Find the maximum bending at point D.
Consider the section BEC, use the similar triangle concept.
Find the maximum bending at point D.
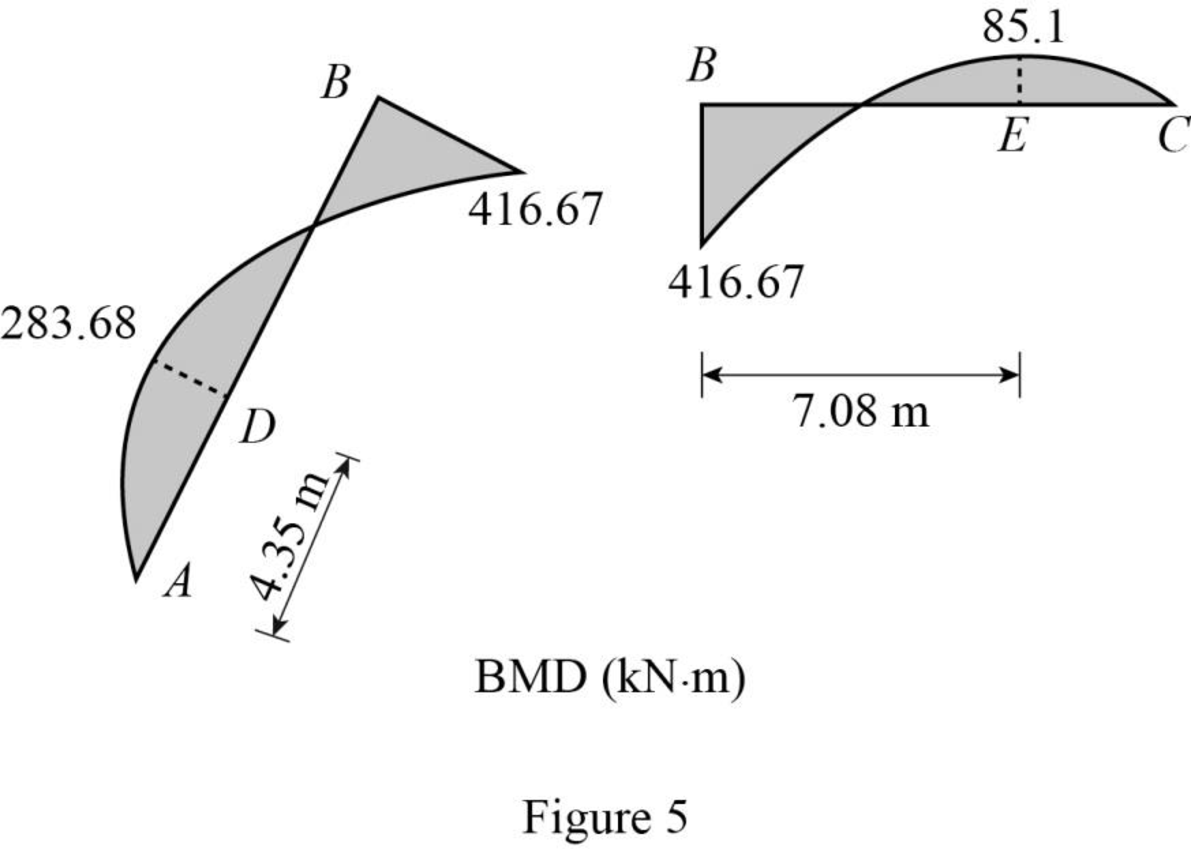
Plot the bending moment diagram as in Figure 5.
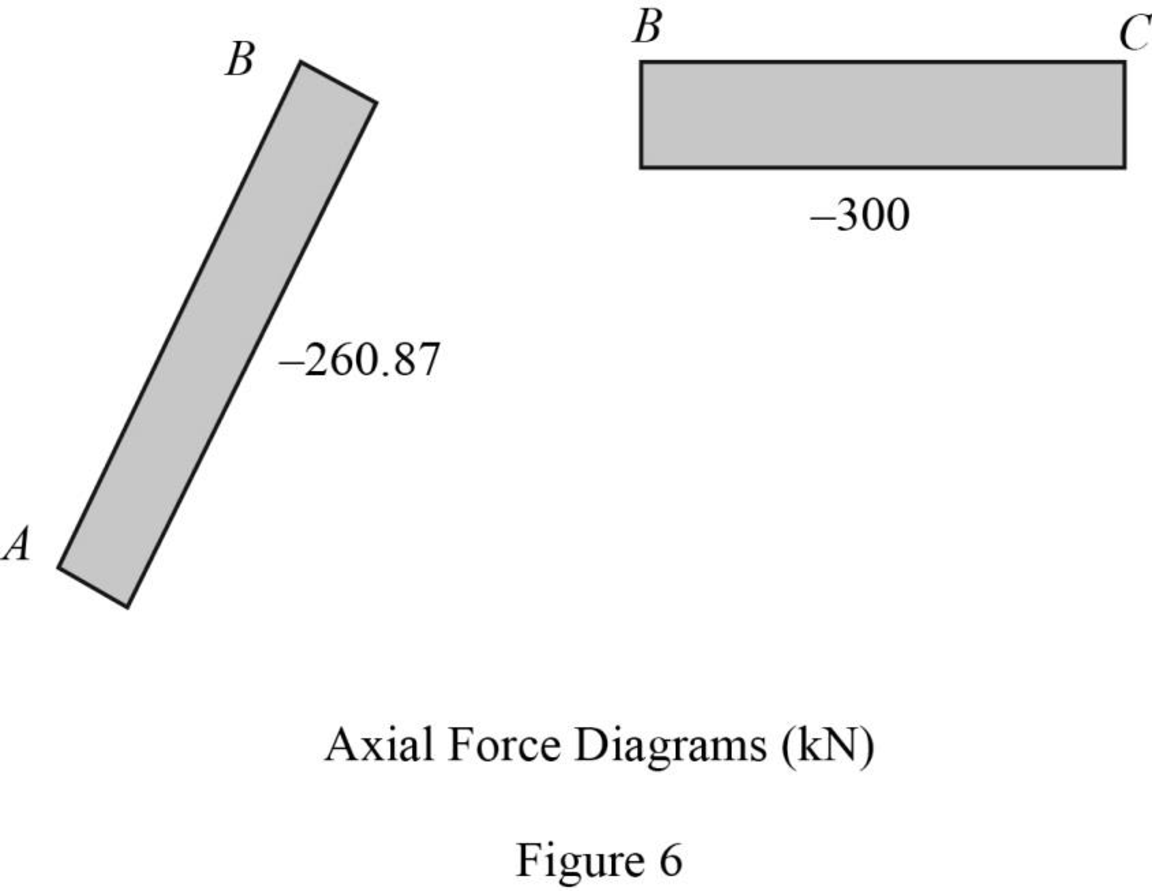
Plot the axial force diagram as in Figure 6.
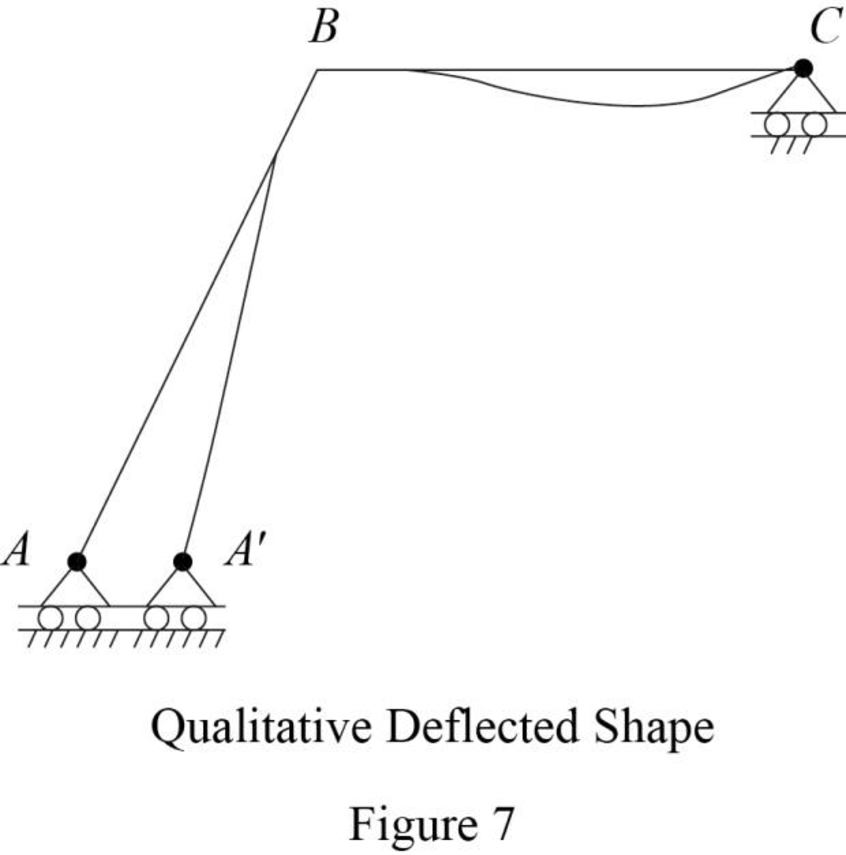
Plot the qualitative deflected shape as in Figure 7.
Want to see more full solutions like this?
Chapter 5 Solutions
Structural Analysis, Si Edition


- how to manually plotting by coordinatesarrow_forwardmapping surveys/mappingarrow_forwardQuestion 3 (15pt) A traffic signal control is being designed for a four-leg intersection on a divided highway with the characteristics show in the table below. Determine an appropriate length of the yellow interval for each approach. (assuming the average vehicle length is 20ft, and the perception-reaction time is 1.0 sec, and deceleration rate of 11.2ft/sec²) Median width (ft) Number of 12ft lanes on each approach Design speed (mph) Grade North South approaches East West Approaches 18 3 45 0 10 2 35 3.5 SPEED LIMIT 45 18ft SPEED LIMIT 45 5arrow_forward
- Hi! Can you help me compute the concrete and masonry works for this structure based on the attached elevation drawing?The image shows the side view of a small building with labeled sections, wall openings (windows), and dimensions in centimeters. Specifically, I need help computing the following: For Concrete Works: Volume of concrete for footings, columns, and slab (if applicable) For Masonry Works (CHB Walls): Total wall area (excluding window openings) Number of CHBs required (based on 0.4 m x 0.2 m CHB) Cement and sand for block laying Cement, sand, and gravel for core filling (if reinforced) Cement and fine sand for plastering (both sides) Rebars needed for CHB reinforcement (if any) Please base it on the drawing dimensions. Let me know if additional assumptions or standards are needed (e.g., CHB size, mix ratio, thickness of plaster). Thank you!arrow_forwardHi! Can you help me compute the Masonry Works for the 3rd Floor only based on this image?This image shows all my completed concrete, rebar, slab, and formwork computations for the 3rd floor of a 3-storey residential building. Specifically, I need the following for CHB walls: Quantity of CHB Cement & sand for block laying (mortar) Cement, sand, and gravel for core filling Cement & fine sand for plastering Cement, sand, and gravel for CHB wall footing Number and length of vertical & horizontal rebars (10mm or as required)arrow_forwardP16.11 WP An assembly consisting of tie rod (1) and pipe strut (2) is used to support an 80 kip load, which is applied to joint B. Strut (2) is a pin-connected steel [E = 29,000 ksi] pipe with an outside diameter of 8.625 in. and a wall thickness of 0.322 in. For the loading shown in Figure P16.11, determine the factor of safety with respect to buckling for member (2). A C 24 ft B 80 kips FIGURE P16.11 12 ft 30 ftarrow_forward
- Hi! Based on the computations I've already completed for the second floor (shown in the attached image), can you help me compute the required materials for masonry works? Specifically, I need the following: Total quantity of CHB (Concrete Hollow Blocks) Cement and sand for block laying (mortar) Cement, sand, and gravel for CHB core filling Cement and fine sand for plastering Cement, sand, and gravel for CHB footing with pest control Reinforcing steel bars (vertical and horizontal) Please assume standard block size (e.g., 0.4m x 0.2m x 0.2m) and standard mortar/plaster thickness if not specified. Thank you!"arrow_forwardHi! I would like helping hand in computing all the materials needed for masonry works (CHB walls) on the ground floor. I’ve already computed the other structural elements — please refer to the attached image.arrow_forwardHi! Kindly help me compute the following based on the attached elevation plan and floor plan: Total Perimeter of the building – to be used for layouting. Total Length of Batter Board – include all sides where batter boards will be installed. Number and spacing of Stakes – assuming a stake is placed every 1.2 meters along the perimeter. Please show the complete solution and breakdown of your computation. Thank you!arrow_forward
- E D (B) (<) 2945 3725 250 2225 Car Port 5000 2500 Pool Area 2 3925 3465 2875 13075 Staff Room Bar Counter 1 GROUND FLOOR PLAN SCALE 1:100 Hallway 3 1560 4125 3125 $685 Laundry & Service Area 5 A Common T&B Kitchen & Dining Arear B Living Area 2425 Terrace E 2 12150 1330 2945 4150 5480 1800 3725 1925 3800 3465 2 3 9150 4125 3575 3925 Terrace Toilet & Bathroom Toilet Bathroom Bedroom 1 Bedroom 2 SECOND FLOOR PLAN SCALE Hallway 1:100 OPEN TO BELOW E B A 3 3725 2150 1330 2945 5480 4150 1925 ⑨ 2 9150 3800 4125 3465 3575 3925 Terrace R Toilet & Bathroom Toilet & Bathroom SECOND FLOOR PLAN SCALE Hallway 1:100 OPEN TO BELOW +arrow_forwardQ2/ In a design of a portable sprinkler system, the following information is given: • • The sprinklers are distributed in a square pattern with radius of the wetted circle of the sprinkler=15 m Consumption rate = 10 mm/day Efficiency of irrigation = 60% Net depth of irrigation (NDI)= 80 mm. Find the following: 1-Sprinkler application rate if HRS = 11. 2-Number of pipes required for irrigation. (50 Marks) 3-Discharge of sprinkler, diameter of nozzle, and the working head pressure if C=0.90. 4-Diameter of the sprinkler pipe for Slope=0. 5-Pressure head at the inlet and at the dead end of the sprinkler pipe for Slope=0. (F² + L²)((SF)² + L²) L² 2L² ≤ D² L² + S² ≤ D² A, = * 1000 S*L ≤D² N W Af m-11-P L' Hf = 1.14*109 * 1.852 * L *F,where c=120 D4.87 Source main pipe 180 m 540 m N 1 1 √m-1 F = im/Nm+1 = + + m+1 2N 6N2 i=1 Nozzle diameter (mm) 3< ds 4.8 4.8< ds 6.4 6.4arrow_forwardMiniatry of Higher scent Research University of Ke Faculty of Engineering Cell Engineering Department 2024-2025 Mid Exam-1 st Attempt Time Date: 17/04/2025 Notes: Answer all questions. Not all figures are to scale. Assume any values if you need them. Q1/ A farm with dimensions and slopes (50 Marks) = shown in the figure below. If you asked to design a border irrigation system and if you know that Net depth of irrigation - 96mm .Manning coefficient = 0.15, Time of work in the farm is 6 hours/day. Design consumption use of water from the crop (ET) 16 mm/day, Width of the agricultural machine equal to 2.5m, Equation of infiltration - D= 12-05 and Efficiency of irrigation= 60%. You can neglect the recession lag time. Find the width and number of the borders, Irrigation interval and time required to irrigate the whole farm, Depth of flow in the inlet of border Number of borders that irrigated in one day and The neglected recession lag time Slope of irrigation % Maximum border width 0-0.1 30…arrow_forwardarrow_back_iosSEE MORE QUESTIONSarrow_forward_ios
