
(a)
Interpretation:
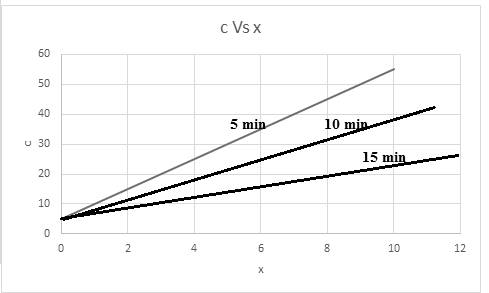
A graph of concentration (c) with x in centimeter at a time for
Concept introduction:
Fick's Law of diffusion: This law states that molar flux is directly proportional to concentration gradient. The law is stated as:
Where,
J is the molar flux defined as the number of atoms passing per unit area per unit time.
D is the diffusion coefficient in
Factors affection diffusion are as follows:
- Temperature
- Diffusion coefficient
The following equation is stated as:
Where,
Q is the activation energy in calorie/ mole.
R is universal gas constant in
T is the absolute temperature in kelvin.
Answer to Problem 5.71P
The required graph for concentration versus x is shown below:
Explanation of Solution
Given information:
The equation used is given as,
Where,
Q is the initial surface concentration having unit of
Temperature for water is
Diffusion coefficient of phosphorous in silicon at a temperature of
t is the time in seconds.
Given equation for finding out the plot between of concentration (c) with x,
Based on given data calculation of
Substituting the values,
The relationship of concentration at a time of 5 min is,
Given equation for finding out the plot between of concentration (c) with x,
Based on given data calculation of
Substituting the values,
The relationship of concentration at a time of 10 min is,
Given equation for finding out the plot between of concentration (c) with x,
Based on given data calculation of
Substituting the values,
The relationship of concentration at a time of 15 min is,
Thus, based on given relation the concentration is dependent on x and t. The graph for the same considering time into consideration,

The graph is representing the linear slope of concentration versus x with respect to given time.
(b)
Interpretation:
Time required by the phosphorous concentration to make it equal to the concentration of boron at a depth of
Concept introduction:
Fick's Law of diffusion: This law states that molar flux is directly proportional to concentration gradient. The law is stated as:
Where,
J is the molar flux defined as the number of atoms passing per unit area per unit time.
D is the diffusion coefficient in
Factors affection diffusion are as follows:
- Temperature
- Diffusion coefficient
The following equation is stated as:
Where,
Q is the activation energy in calorie/ mole.
R is universal gas constant in
T is the absolute temperature in kelvin.
Answer to Problem 5.71P
Thus, the value of Time required by the phosphorous concentration to make it equal to the concentration of boron at a depth of
Explanation of Solution
Given information:
The equation used is given as,
Where,
Q is the initial surface concentration having unit of
Temperature for water is
Diffusion coefficient of phosphorous in silicon at a temperature of
t is the time in seconds.
Given equation for finding out the value of time (t) in seconds
Based on given data calculation of
Substituting the values,
On solving the equation,
t = 49758906
Conversion of seconds to hours,
Thus, the value of Time required by the phosphorous concentration to make it equal to the concentration of boron at a depth of
Want to see more full solutions like this?
Chapter 5 Solutions
Essentials of Materials Science and Engineering, SI Edition

- Don't use ai to answer I will report you answerarrow_forwardThe assignment here is to write an app using a database named CIT321 with a collection named students; we will provide a CSV file of the data. You need to use Vue.js to display 2 pages. You should know that this assignment is similar, all too similar in fact, to the cars4sale2 example in the lecture notes for Vue.js 2. You should study that program first. If you figure out cars4sale2, then program 6 will be extremely straightforward. It is not my intent do drop a ton of new material here in the last few days of class. The database contains 51 documents. The first rows of the CSV file look like this: sid last_name 1 Astaire first_name Humphrey CIT major hrs_attempted gpa_points 10 34 2 Bacall Katharine EET 40 128 3 Bergman Bette EET 42 97 4 Bogart Cary CIT 11 33 5 Brando James WEB 59 183 6 Cagney Marlon CIT 13 40 GPA is calculated as gpa_points divided by hrs_attempted. GPA points would have been arrived at by adding 4 points for each credit hour of A, 3 points for each credit hour of…arrow_forwardEstimate the material quantities (cement, sand, gravel, and steel reinforcement) required for constructing 120 m concrete channel of the following typical cross section, concrete mix of 1:1.5:3 and thickness of 20 cm. Figure (1) Figure (1) 12250- 16300arrow_forward
- 1 8 4 Add numbers so that the sum of any row or column equals .30 Use only these numbers: .1.2.3.4.5.6.10.11.12.12.13.14.14arrow_forwardChoose the correct answer for from the following sentences: 1. The purpose of the microprocessor is to control b. memory c. processing d. tasks a. switches 2. Which of the following instructions represents base-plus-index addressing mode? a. MOV AL,[BX] b. MOV AL,[SI] c. MOV AL,BX d. MOV AL,[BX+SI] 3. The BIU pre-fetches the instruction from memory and store them in b. memory c. stack d. queue a. register 4. Which function is used to control the PWM (Pulse Width Modulation) on the Arduino output pin? a. digitalRead() b. analogRead() c. digitalWrite() 5. Which port in the PIC16F877A has an 8 external interrupt inputs? a. Port-A b. Port-C c. Port-B d. analogWrite() d. Port-D d. 4KByte 6. How much Flash EEPROM memory program found in the PIC16F877A microcontroller? a. 32KByte b. 16KByte c. 8KBytearrow_forwardSolve and select the correct answer: 2. For a random variable X with pdf: p(x) value of x is = 119 10 for -5≤x≤5. The mean (a) -75 (b) 10 (c) 0 (d) 75 3. Is the matrix A = = [1] orthogonal? Find the rank of A? 0 (a) YES, -1 (b) NO, 2 (c) YES, 2 (d) NO, -1 4. L{et sin(3t)u(t)) = (a) s-3 (s-2)²+9 2 (b) (5-3)² (c) (s-3)²+4 S-2 3 (s-2)²+9 (d) (5-2)²+9 = 5. Given that x is a constant. Choose all the correct solutions for [∞ (AB)] = (a) (AB)T (b) x ATBT (c) α BTAT (d) x (AB)Tarrow_forward
- Uppgift 2 (9p) I77777 20 kN 10 kN/m 4 [m] 2 2 Bestäm tvärkrafts- och momentdiagram för balken i figuren ovan. Extrempunkter ska anges med både läge och värde i diagrammen.arrow_forwardDO NOT WANT AI WILL REJECTarrow_forward3. Roughly sketch the root locus for the following locations of open-loop poles and zeros. You just need to show the shape of the root locus; you do not calculate the asymptote, break-in, and break-away points. ☑ (a) (b) ☑ Φ ① $3 (c)arrow_forward
- **Problem 8-45.** The man has a mass of 60 kg and the crate has a mass of 100 kg. If the coefficient of static friction between his shoes and the ground is \( \mu_s = 0.4 \) and between the crate and the ground is \( \mu_c = 0.3 \), determine if the man is able to move the crate using the rope-and-pulley system shown. **Diagram Explanation:** The diagram illustrates a scenario where a man is attempting to pull a crate using a rope-and-pulley system. The setup is as follows: - **Crate (C):** Positioned on the ground with a rope attached. - **Rope:** Connects the crate to a pulley system and extends to the man. - **Pulley on Tree:** The rope runs over a pulley mounted on a tree which redirects the rope. - **Angles:** - The rope between the crate and tree forms a \(30^\circ\) angle with the horizontal. - The rope between the tree and the man makes a \(45^\circ\) angle with the horizontal. - **Man (A):** Pulling on the rope with the intention of moving the crate. This arrangement tests the…arrow_forwardDO NOT WANT AI WILL REJECTarrow_forwardDO NOT NEED AI WILL REJECTarrow_forward
 MATLAB: An Introduction with ApplicationsEngineeringISBN:9781119256830Author:Amos GilatPublisher:John Wiley & Sons Inc
 Essentials Of Materials Science And EngineeringEngineeringISBN:9781337385497Author:WRIGHT, Wendelin J.Publisher:Cengage,
 Industrial Motor ControlEngineeringISBN:9781133691808Author:Stephen HermanPublisher:Cengage Learning
 Basics Of Engineering EconomyEngineeringISBN:9780073376356Author:Leland Blank, Anthony TarquinPublisher:MCGRAW-HILL HIGHER EDUCATION
 Structural Steel Design (6th Edition)EngineeringISBN:9780134589657Author:Jack C. McCormac, Stephen F. CsernakPublisher:PEARSON
 Fundamentals of Materials Science and Engineering...EngineeringISBN:9781119175483Author:William D. Callister Jr., David G. RethwischPublisher:WILEY