Concept explainers
Videos
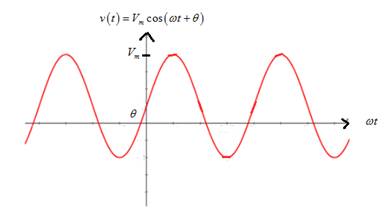
Consider the plot of the sinusoidal voltage
- Stretches the sinusoidal curve vertically.
Which statement best describes
b. Increasing the frequency f?
c. Decreasing
d. Decreasing the angular frequency w?
e. Increasing the period?
(a)
Change in sinusoidal voltage graph if peak amplitude is increased.
Answer to Problem 5.1P
Increasing the peak amplitude stretches the sinusoidal curve vertically.
Option (1).
Explanation of Solution
Given information:
Given sinusoidal voltage is
Calculation:
Graph of sinusoidal voltage is
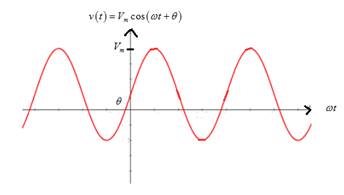
From the graph, it is noted thatif peak amplitude Vm is increased, it stretches the sinusoidal curve vertically.
(b)
Change in sinusoidal voltage graph if frequency is increased.
Answer to Problem 5.1P
Increasing the frequency compresses the sinusoidal curve horizontally.
Option (4).
Explanation of Solution
Given information:
Given sinusoidal voltage is
Calculation:
Graph of sinusoidal voltage is

From the graph, it is noted that if the frequency is increased,the time period is reduced so that it compresses the sinusoidal curve horizontally.
(c)
Change in sinusoidal voltage graph if phase angle (theta) is decreased.
Answer to Problem 5.1P
Decreasing the phase angle (theta) translates the sinusoidal curve to the right.
Option (5).
Explanation of Solution
Given information:
Given sinusoidal voltage is
Calculation:
Graph of sinusoidal voltage is

From the graph, it is noted that if the phase angle (theta) is decreased, it translates the sinusoidal curve to the right.
(d)
Change in sinusoidal voltage graph if the angular frequency is decreased.
Answer to Problem 5.1P
Decreasing the angular frequency stretches the sinusoidal voltage graph horizontally.
Option (3).
Explanation of Solution
Given information:
Given sinusoidal voltage is
Calculation:
Graph of sinusoidal voltage is
From the graph, it is noted that if the angular frequency is decreased, it increases the time period of the curve,which means it stretches sinusoidal horizontally.
(e)
Change in sinusoidal voltage graph if the time period is increased.
Answer to Problem 5.1P
Increasing the time period stretches the sinusoidal voltage graph horizontally.
Option (3).
Explanation of Solution
Given information:
Given sinusoidal voltage is
Calculation:
Graph of sinusoidal voltage is

From the graph, it is noted that if time period is increased, it stretches the sinusoidal voltage graph horizontally.
Want to see more full solutions like this?
Chapter 5 Solutions
Electrical Engineering: Principles & Applications (7th Edition)
Additional Engineering Textbook Solutions
Elementary Surveying: An Introduction To Geomatics (15th Edition)
Computer Science: An Overview (13th Edition) (What's New in Computer Science)
Degarmo's Materials And Processes In Manufacturing
Mechanics of Materials (10th Edition)
Introduction To Programming Using Visual Basic (11th Edition)
Java: An Introduction to Problem Solving and Programming (8th Edition)


- Don't use ai to answer I will report you answerarrow_forwardThe values of the elements in the circuit given in the figure are given below. Find the maximum average power that can be transferred to the ZL load. Vg=5cos(10000t) VoltR=38 kilo ohmC=35 nano faradL=150 milli henryarrow_forwardPrelab Information 1. Laboratory Preliminary Discussion Second-order RC Circuit Analysis The second-order RC circuit shown in figure 1 below represents all voltages and impedances as functions of the complex variable, s. Note, of course, that the impedances associated with Rs, R₁, and R2 are constant independent of frequency, so the 's' notation is omitted. Again, one of the advantages of s-domain analysis is that we can apply all of the circuit analysis techniques learned for AC and DC circuits. To generate the s-domain expression for the output voltage, Vout(s) = Vc2(s), for the circuit shown in figure 1, we can apply voltage division in the s-domain as shown in equation 1 below. Equation 1 will be used in the prelab computations to find an expression for the output voltage, vc2(t), in the time domain. Note also that when we collect frequency response data for the circuit it will be operating at AC steady-state conditions for each frequency tested. Note that under AC steady-state…arrow_forward
- Don't use ai to answer I will report you answerarrow_forwardThe power values of the loads in the circuit given in the figure are given below. Accordingly, which of the following is the RMS value of the Vs voltage amplitude? Load 1 (L1): the power factor is 1 and draws 13 kW of power,Load 2 (L2): draws 1 kVA at a forward power factor of 0.6,Load 3 (L3): draws 4 kW of average power and gives 3 kVAR of reactive power.arrow_forwardThe values of the elements in the circuit given in the figure are given below. Find the average power value on the R2 resistor. (Hint: First find the current of the R2 resistor with the loop current method. Four mutual inductance effect expressions should be added to each of the two loop equations.) Vs=238 voltsR1=13 ohmsR2=15 ohmsarrow_forward
- Don't use ai to answer I will report you answerarrow_forwardA transformer bank is composed of three single-phase transformers of10kVA, 20kV/200V; copper losses are 100 W and core lossesthey are 50 W. The bank is connected in Delta on the high voltage side and in star on the sidethe low-voltage side. A. What are the values of voltages B.What are the values of currents C. losses in the core and losses in copper. D. nominal power of the transformer bank.Solve by one of the experts, not using artificial intelligencearrow_forwardA 50 kVA, 13800/208 V transformer connected in Dy has an Rcc of 1% and aXcc of 7% per unit. A. What is the voltage regulation at full load and fp 0.8 in delay using the values of theimpedance (Ω).b. What is the voltage regulation under the same conditions using the system per unit Solve by one of the experts, not using artificial inteliggencearrow_forward
 Introductory Circuit Analysis (13th Edition)Electrical EngineeringISBN:9780133923605Author:Robert L. BoylestadPublisher:PEARSON
 Delmar's Standard Textbook Of ElectricityElectrical EngineeringISBN:9781337900348Author:Stephen L. HermanPublisher:Cengage Learning
 Programmable Logic ControllersElectrical EngineeringISBN:9780073373843Author:Frank D. PetruzellaPublisher:McGraw-Hill Education
 Fundamentals of Electric CircuitsElectrical EngineeringISBN:9780078028229Author:Charles K Alexander, Matthew SadikuPublisher:McGraw-Hill Education
 Electric Circuits. (11th Edition)Electrical EngineeringISBN:9780134746968Author:James W. Nilsson, Susan RiedelPublisher:PEARSON
 Engineering ElectromagneticsElectrical EngineeringISBN:9780078028151Author:Hayt, William H. (william Hart), Jr, BUCK, John A.Publisher:Mcgraw-hill Education,