
Concept explainers
Videos
These review exercises are for test preparation. They can also be used as a practice test. Answers are at the back of the book. The red bracketed section references tell you what part(s) of the chapter to restudy if your answer is incorrect.
Concept Reinforcement
Match each term in column A with the most appropriate graph in column B.
| Column A | Column B |
| Consumer Surplus
|
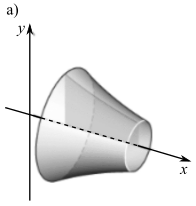
a. a)  |
The graph from the provided options that matches the provided term “consumer surplus”.
Answer to Problem 1RE
Solution:
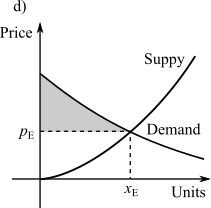
The graph that matches with the provided term “consumer surplus”is (d).
Explanation of Solution
Given information:
The provided term is “consumer surplus” choices of graphs are:

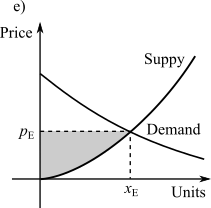
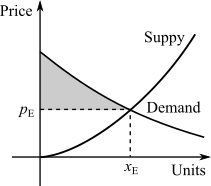
Consider the provided term, “Consumer surplus”
The consumer surplus is the profit obtained by consumer when he paid less than the amount, he wishes to pay for a product.
It is convenient to consider a demand and supply as a function of price. For this we will think of demand and supply as prices that are functions of quantity as:
The consumer demand curve is the graph of
Hence the graph ‘d’matches the provided term as its price decrease with the increase in quantity as shown below:
Want to see more full solutions like this?
Chapter 5 Solutions
Calculus and Its Applications (11th Edition)
Additional Math Textbook Solutions
College Algebra (7th Edition)
Algebra and Trigonometry (6th Edition)
Elementary Statistics: Picturing the World (7th Edition)
Intro Stats, Books a la Carte Edition (5th Edition)
Introductory Statistics
A Problem Solving Approach To Mathematics For Elementary School Teachers (13th Edition)


- Estimate the instantaneous rate of change of the function f(x) = 2x² - 3x − 4 at x = -2 using the average rate of change over successively smaller intervals.arrow_forwardGiven the graph of f(x) below. Determine the average rate of change of f(x) from x = 1 to x = 6. Give your answer as a simplified fraction if necessary. For example, if you found that msec = 1, you would enter 1. 3' −2] 3 -5 -6 2 3 4 5 6 7 Ꮖarrow_forwardGiven the graph of f(x) below. Determine the average rate of change of f(x) from x = -2 to x = 2. Give your answer as a simplified fraction if necessary. For example, if you found that msec = , you would enter 3 2 2 3 X 23arrow_forward
- A function is defined on the interval (-π/2,π/2) by this multipart rule: if -π/2 < x < 0 f(x) = a if x=0 31-tan x +31-cot x if 0 < x < π/2 Here, a and b are constants. Find a and b so that the function f(x) is continuous at x=0. a= b= 3arrow_forwardUse the definition of continuity and the properties of limits to show that the function is continuous at the given number a. f(x) = (x + 4x4) 5, a = -1 lim f(x) X--1 = lim x+4x X--1 lim X-1 4 x+4x 5 ))" 5 )) by the power law by the sum law lim (x) + lim X--1 4 4x X-1 -(0,00+( Find f(-1). f(-1)=243 lim (x) + -1 +4 35 4 ([ ) lim (x4) 5 x-1 Thus, by the definition of continuity, f is continuous at a = -1. by the multiple constant law by the direct substitution propertyarrow_forward1. Compute Lo F⚫dr, where and C is defined by F(x, y) = (x² + y)i + (y − x)j r(t) = (12t)i + (1 − 4t + 4t²)j from the point (1, 1) to the origin.arrow_forward
- 2. Consider the vector force: F(x, y, z) = 2xye²i + (x²e² + y)j + (x²ye² — z)k. (A) [80%] Show that F satisfies the conditions for a conservative vector field, and find a potential function (x, y, z) for F. Remark: To find o, you must use the method explained in the lecture. (B) [20%] Use the Fundamental Theorem for Line Integrals to compute the work done by F on an object moves along any path from (0,1,2) to (2, 1, -8).arrow_forwardhelp pleasearrow_forwardIn each of Problems 1 through 4, draw a direction field for the given differential equation. Based on the direction field, determine the behavior of y as t → ∞. If this behavior depends on the initial value of y at t = 0, describe the dependency.1. y′ = 3 − 2yarrow_forward
- B 2- The figure gives four points and some corresponding rays in the xy-plane. Which of the following is true? A B Angle COB is in standard position with initial ray OB and terminal ray OC. Angle COB is in standard position with initial ray OC and terminal ray OB. C Angle DOB is in standard position with initial ray OB and terminal ray OD. D Angle DOB is in standard position with initial ray OD and terminal ray OB.arrow_forwardtemperature in degrees Fahrenheit, n hours since midnight. 5. The temperature was recorded at several times during the day. Function T gives the Here is a graph for this function. To 29uis a. Describe the overall trend of temperature throughout the day. temperature (Fahrenheit) 40 50 50 60 60 70 5 10 15 20 25 time of day b. Based on the graph, did the temperature change more quickly between 10:00 a.m. and noon, or between 8:00 p.m. and 10:00 p.m.? Explain how you know. (From Unit 4, Lesson 7.) 6. Explain why this graph does not represent a function. (From Unit 4, Lesson 8.)arrow_forwardFind the area of the shaded region. (a) 5- y 3 2- (1,4) (5,0) 1 3 4 5 6 (b) 3 y 2 Decide whether the problem can be solved using precalculus, or whether calculus is required. If the problem can be solved using precalculus, solve it. If the problem seems to require calculus, use a graphical or numerical approach to estimate the solution. STEP 1: Consider the figure in part (a). Since this region is simply a triangle, you may use precalculus methods to solve this part of the problem. First determine the height of the triangle and the length of the triangle's base. height 4 units units base 5 STEP 2: Compute the area of the triangle by employing a formula from precalculus, thus finding the area of the shaded region in part (a). 10 square units STEP 3: Consider the figure in part (b). Since this region is defined by a complicated curve, the problem seems to require calculus. Find an approximation of the shaded region by using a graphical approach. (Hint: Treat the shaded regi as…arrow_forward
 Glencoe Algebra 1, Student Edition, 9780079039897...AlgebraISBN:9780079039897Author:CarterPublisher:McGraw Hill
 Algebra: Structure And Method, Book 1AlgebraISBN:9780395977224Author:Richard G. Brown, Mary P. Dolciani, Robert H. Sorgenfrey, William L. ColePublisher:McDougal Littell
 Elementary AlgebraAlgebraISBN:9780998625713Author:Lynn Marecek, MaryAnne Anthony-SmithPublisher:OpenStax - Rice University
 Holt Mcdougal Larson Pre-algebra: Student Edition...AlgebraISBN:9780547587776Author:HOLT MCDOUGALPublisher:HOLT MCDOUGAL
 Algebra for College StudentsAlgebraISBN:9781285195780Author:Jerome E. Kaufmann, Karen L. SchwittersPublisher:Cengage Learning