
APPLIED STAT.IN BUS.+ECONOMICS
6th Edition
ISBN: 9781259957598
Author: DOANE
Publisher: RENT MCG
expand_more
expand_more
format_list_bulleted
Concept explainers
Videos
Textbook Question
Chapter 4.5, Problem 45SE
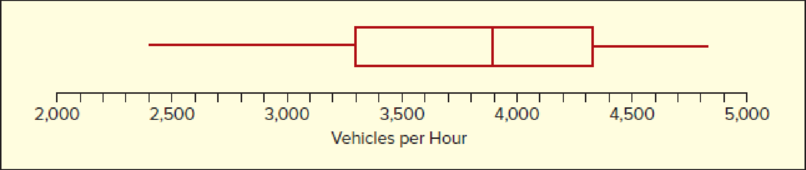
On San Martin Boulevard, embedded sensors kept track of the vehicle traffic count each hour for five weekdays, Monday through Friday, between 6 a.m. and 8 p.m. (5 weeks × 14 hours = 70 observations). (a) Visually estimate the
Expert Solution & Answer
Want to see the full answer?
Check out a sample textbook solution
Students have asked these similar questions
Business
3. Bayesian Inference – Updating Beliefs
A medical test for a rare disease has the following characteristics:
Sensitivity (true positive rate): 99%
Specificity (true negative rate): 98%
The disease occurs in 0.5% of the population.
A patient receives a positive test result.
Questions:
a) Define the relevant events and use Bayes’ Theorem to compute the probability that the patient actually has the disease.b) Explain why the result might seem counterintuitive, despite the high sensitivity and specificity.c) Discuss how prior probabilities influence posterior beliefs in Bayesian inference.d) Suppose a second, independent test with the same accuracy is conducted and is also positive. Update the probability that the patient has the disease.
4. Linear Regression - Model Assumptions and Interpretation
A real estate analyst is studying how house prices (Y) are related to house size in square feet (X). A simple
linear regression model is proposed:
The analyst fits the model and obtains:
•
Ŷ50,000+150X
YBoB₁X + €
•
R² = 0.76
• Residuals show a fan-shaped pattern when plotted against fitted values.
Questions:
a) Interpret the slope coefficient in context.
b) Explain what the R² value tells us about the model's performance.
c) Based on the residual pattern, what regression assumption is likely violated? What might be the
consequence?
d) Suggest at least two remedies to improve the model, based on the residual analysis.
Chapter 4 Solutions
APPLIED STAT.IN BUS.+ECONOMICS
Ch. 4.2 - (a) For each data set, find the mean, median, and...Ch. 4.2 - For each data set, is the mode a good measure of...Ch. 4.2 - For each data set, is the mode a good measure of...Ch. 4.2 - For each data set, which best indicates a typical...Ch. 4.2 - For each data set, which best indicates a typical...Ch. 4.2 - Days on the market are shown for the 36 most...Ch. 4.2 - Scores are shown for the most recent state civil...Ch. 4.2 - A vehicle emissions testing facility can process...Ch. 4.2 - CitiBank recorded the number of customers to use a...Ch. 4.2 - Prob. 10SE
Ch. 4.2 - Prob. 11SECh. 4.2 - Prob. 12SECh. 4.2 - (a) Write the Excel function for the 10 percent...Ch. 4.2 - Prob. 14SECh. 4.2 - Prob. 15SECh. 4.2 - Spirit Airlines kept track of the number of empty...Ch. 4.2 - CitiBank recorded the number of customers to use a...Ch. 4.2 - On Friday night, the owner of Chez Pierre in...Ch. 4.2 - Prob. 19SECh. 4.2 - The number of internet users in Latin America grew...Ch. 4.3 - (a) Find the mean and standard deviation for each...Ch. 4.3 - For each data set: (a) Find the mean. (b) Find the...Ch. 4.3 - In fuel economy tests in city driving conditions,...Ch. 4.3 - Over the past month, Bobs bowling score mean was...Ch. 4.3 - Prob. 25SECh. 4.3 - Prob. 26SECh. 4.3 - (a) Find the coefficient of variation for prices...Ch. 4.3 - Prob. 28SECh. 4.3 - Noodles and Company tested consumer reaction to...Ch. 4.4 - (a) By Chebyshevs Theorem, at least how many...Ch. 4.4 - An exam has a mean of 70 with a standard deviation...Ch. 4.4 - Prob. 32SECh. 4.4 - The mean collection period for accounts receivable...Ch. 4.4 - Convert each individual data value to a...Ch. 4.4 - Prob. 35SECh. 4.4 - Prob. 36SECh. 4.4 - Find the original data value corresponding to each...Ch. 4.4 - CitiBank recorded the number of customers to use a...Ch. 4.4 - Prob. 39SECh. 4.5 - Scores on an accounting exam ranged from 42 to 96,...Ch. 4.5 - In 2007, total compensation (in thousands of...Ch. 4.5 - Waiting times (minutes) for a table at Joeys BBQ...Ch. 4.5 - Coffee temperatures (degrees Fahrenheit) at a...Ch. 4.5 - Prob. 44SECh. 4.5 - On San Martin Boulevard, embedded sensors kept...Ch. 4.5 - Prob. 46SECh. 4.5 - Prob. 47SECh. 4.6 - For each X-Y data set (n = 12): (a) Make a scatter...Ch. 4.6 - Closing prices of two stocks are recorded for 50...Ch. 4.6 - Prob. 50SECh. 4.6 - Prob. 51SECh. 4.7 - Estimate the mean from this table of grouped data...Ch. 4.7 - Estimate the mean from the following table of...Ch. 4 - What are descriptive statistics? How do they...Ch. 4 - Explain each concept: (a) center, (b) variability,...Ch. 4 - Prob. 3CRCh. 4 - List strengths and weaknesses of each measure of...Ch. 4 - Prob. 5CRCh. 4 - (a) What is a bimodal distribution? (b) Explain...Ch. 4 - Prob. 7CRCh. 4 - Prob. 8CRCh. 4 - (a) Which standard deviation formula (population,...Ch. 4 - (a) To what kind of data does Chebyshevs Theorem...Ch. 4 - Prob. 11CRCh. 4 - Prob. 12CRCh. 4 - Prob. 13CRCh. 4 - Prob. 14CRCh. 4 - (a) Explain the method of medians for calculating...Ch. 4 - (a) What is a box plot? What does it tell us? (b)...Ch. 4 - Prob. 17CRCh. 4 - Prob. 18CRCh. 4 - Prob. 19CRCh. 4 - (a) What is kurtosis? (b) Sketch a platykurtic...Ch. 4 - Prob. 54CECh. 4 - If the mean asset turnover for retail firms is...Ch. 4 - Prob. 56CECh. 4 - During a rock concert, the noise level (in...Ch. 4 - Bags of jelly beans have a mean weight of 396 gm...Ch. 4 - Based on experience, the Ball Corporations...Ch. 4 - SAT scores for the entering class of 2010 at...Ch. 4 - Prob. 61CECh. 4 - The average time a Boulder High varsity lacrosse...Ch. 4 - Prob. 63CECh. 4 - Below are monthly rents paid by 30 students who...Ch. 4 - How many days in advance do travelers purchase...Ch. 4 - The durations (minutes) of 26 electric power...Ch. 4 - The U.S. Postal Service will ship a Priority Mail...Ch. 4 - Prob. 68CECh. 4 - Prob. 69CECh. 4 - Prob. 70CECh. 4 - Prob. 71CECh. 4 - A plumbing suppliers mean monthly demand for vinyl...Ch. 4 - Prob. 73CECh. 4 - Analysis of investment portfolio returns over a...Ch. 4 - Prob. 75CECh. 4 - Caffeine content in a 5-ounce cup of brewed coffee...Ch. 4 - Prob. 77CECh. 4 - Prob. 78CECh. 4 - Prob. 79CECh. 4 - Prob. 80CECh. 4 - Prob. 81CECh. 4 - Prob. 82CECh. 4 - Prob. 83CECh. 4 - The median waiting time for a liver transplant in...Ch. 4 - A small suburban community agreed to purchase...Ch. 4 - A companys contractual trigger point for a union...Ch. 4 - Prob. 87CECh. 4 - (a) Enter the Excel function...Ch. 4 - Note: In each of the following tables, the upper...Ch. 4 - This table shows the distribution of winning times...Ch. 4 - The self-reported number of hours worked per week...Ch. 4 - How long does it take to fly from Denver to...Ch. 4 - (a) Make an Excel scatter plot of X = 1990 assault...Ch. 4 - (a) Make an Excel scatter plot of X = airspeed...Ch. 4 - Prob. 97CECh. 4 - (a) Make an Excel scatter plot of X = weekly...Ch. 4 - Prob. 99CECh. 4 - Prob. 1ERQCh. 4 - Which is not an ethical obligation of a...Ch. 4 - Prob. 3ERQCh. 4 - Prob. 4ERQCh. 4 - Give the type of measurement (nominal, ordinal,...Ch. 4 - Prob. 6ERQCh. 4 - To choose a sample of 12 students from a...Ch. 4 - Which of the following is not a reason for...Ch. 4 - Which statement is correct? Why not the others? a....Ch. 4 - Prob. 10ERQCh. 4 - The management of a theme park obtained a random...Ch. 4 - Which one of the following is true? Why not the...Ch. 4 - Prob. 13ERQCh. 4 - Prob. 14ERQCh. 4 - Here are the ages of a random sample of 20 CEOs...Ch. 4 - Prob. 16ERQCh. 4 - Prob. 17ERQCh. 4 - Prob. 18ERQCh. 4 - Which is not a characteristic of using a log scale...
Knowledge Booster


Learn more about
Need a deep-dive on the concept behind this application? Look no further. Learn more about this topic, statistics and related others by exploring similar questions and additional content below.Similar questions
- 5. Probability Distributions – Continuous Random Variables A factory machine produces metal rods whose lengths (in cm) follow a continuous uniform distribution on the interval [98, 102]. Questions: a) Define the probability density function (PDF) of the rod length.b) Calculate the probability that a randomly selected rod is shorter than 99 cm.c) Determine the expected value and variance of rod lengths.d) If a sample of 25 rods is selected, what is the probability that their average length is between 99.5 cm and 100.5 cm? Justify your answer using the appropriate distribution.arrow_forward2. Hypothesis Testing - Two Sample Means A nutritionist is investigating the effect of two different diet programs, A and B, on weight loss. Two independent samples of adults were randomly assigned to each diet for 12 weeks. The weight losses (in kg) are normally distributed. Sample A: n = 35, 4.8, s = 1.2 Sample B: n=40, 4.3, 8 = 1.0 Questions: a) State the null and alternative hypotheses to test whether there is a significant difference in mean weight loss between the two diet programs. b) Perform a hypothesis test at the 5% significance level and interpret the result. c) Compute a 95% confidence interval for the difference in means and interpret it. d) Discuss assumptions of this test and explain how violations of these assumptions could impact the results.arrow_forward1. Sampling Distribution and the Central Limit Theorem A company produces batteries with a mean lifetime of 300 hours and a standard deviation of 50 hours. The lifetimes are not normally distributed—they are right-skewed due to some batteries lasting unusually long. Suppose a quality control analyst selects a random sample of 64 batteries from a large production batch. Questions: a) Explain whether the distribution of sample means will be approximately normal. Justify your answer using the Central Limit Theorem. b) Compute the mean and standard deviation of the sampling distribution of the sample mean. c) What is the probability that the sample mean lifetime of the 64 batteries exceeds 310 hours? d) Discuss how the sample size affects the shape and variability of the sampling distribution.arrow_forward
- A biologist is investigating the effect of potential plant hormones by treating 20 stem segments. At the end of the observation period he computes the following length averages: Compound X = 1.18 Compound Y = 1.17 Based on these mean values he concludes that there are no treatment differences. 1) Are you satisfied with his conclusion? Why or why not? 2) If he asked you for help in analyzing these data, what statistical method would you suggest that he use to come to a meaningful conclusion about his data and why? 3) Are there any other questions you would ask him regarding his experiment, data collection, and analysis methods?arrow_forwardBusinessarrow_forwardWhat is the solution and answer to question?arrow_forward
- To: [Boss's Name] From: Nathaniel D Sain Date: 4/5/2025 Subject: Decision Analysis for Business Scenario Introduction to the Business Scenario Our delivery services business has been experiencing steady growth, leading to an increased demand for faster and more efficient deliveries. To meet this demand, we must decide on the best strategy to expand our fleet. The three possible alternatives under consideration are purchasing new delivery vehicles, leasing vehicles, or partnering with third-party drivers. The decision must account for various external factors, including fuel price fluctuations, demand stability, and competition growth, which we categorize as the states of nature. Each alternative presents unique advantages and challenges, and our goal is to select the most viable option using a structured decision-making approach. Alternatives and States of Nature The three alternatives for fleet expansion were chosen based on their cost implications, operational efficiency, and…arrow_forwardBusinessarrow_forwardWhy researchers are interested in describing measures of the center and measures of variation of a data set?arrow_forward
- WHAT IS THE SOLUTION?arrow_forwardThe following ordered data list shows the data speeds for cell phones used by a telephone company at an airport: A. Calculate the Measures of Central Tendency from the ungrouped data list. B. Group the data in an appropriate frequency table. C. Calculate the Measures of Central Tendency using the table in point B. 0.8 1.4 1.8 1.9 3.2 3.6 4.5 4.5 4.6 6.2 6.5 7.7 7.9 9.9 10.2 10.3 10.9 11.1 11.1 11.6 11.8 12.0 13.1 13.5 13.7 14.1 14.2 14.7 15.0 15.1 15.5 15.8 16.0 17.5 18.2 20.2 21.1 21.5 22.2 22.4 23.1 24.5 25.7 28.5 34.6 38.5 43.0 55.6 71.3 77.8arrow_forwardII Consider the following data matrix X: X1 X2 0.5 0.4 0.2 0.5 0.5 0.5 10.3 10 10.1 10.4 10.1 10.5 What will the resulting clusters be when using the k-Means method with k = 2. In your own words, explain why this result is indeed expected, i.e. why this clustering minimises the ESS map.arrow_forward
arrow_back_ios
SEE MORE QUESTIONS
arrow_forward_ios
Recommended textbooks for you
 Glencoe Algebra 1, Student Edition, 9780079039897...AlgebraISBN:9780079039897Author:CarterPublisher:McGraw Hill
 Big Ideas Math A Bridge To Success Algebra 1: Stu...AlgebraISBN:9781680331141Author:HOUGHTON MIFFLIN HARCOURTPublisher:Houghton Mifflin Harcourt
 Trigonometry (MindTap Course List)TrigonometryISBN:9781337278461Author:Ron LarsonPublisher:Cengage Learning
Glencoe Algebra 1, Student Edition, 9780079039897...
Algebra
ISBN:9780079039897
Author:Carter
Publisher:McGraw Hill
Big Ideas Math A Bridge To Success Algebra 1: Stu...
Algebra
ISBN:9781680331141
Author:HOUGHTON MIFFLIN HARCOURT
Publisher:Houghton Mifflin Harcourt
Trigonometry (MindTap Course List)
Trigonometry
ISBN:9781337278461
Author:Ron Larson
Publisher:Cengage Learning
Continuous Probability Distributions - Basic Introduction; Author: The Organic Chemistry Tutor;https://www.youtube.com/watch?v=QxqxdQ_g2uw;License: Standard YouTube License, CC-BY
Probability Density Function (p.d.f.) Finding k (Part 1) | ExamSolutions; Author: ExamSolutions;https://www.youtube.com/watch?v=RsuS2ehsTDM;License: Standard YouTube License, CC-BY
Find the value of k so that the Function is a Probability Density Function; Author: The Math Sorcerer;https://www.youtube.com/watch?v=QqoCZWrVnbA;License: Standard Youtube License