
Concept explainers
Videos
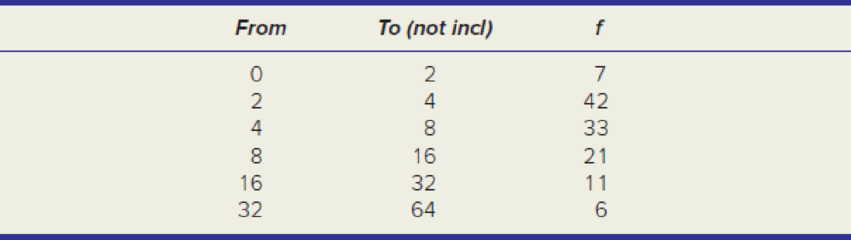
Note: In each of the following tables, the upper bin limit is excluded from that bin but is included as the lower limit of the next bin.
A random sample of individuals who filed their own income taxes were asked how much time (hours) they spent preparing last year’s federal income tax forms. (a) Estimate the
a.
Estimate the mean from the grouped data and frequencies.
Answer to Problem 89CE
The mean from the grouped data and frequencies is 9.458.
Explanation of Solution
Calculation:
The given information is about the random sample of individuals who filed their own taxes and time spent by them for the federal income tax forms during last year.
The mean for the grouped data is:
Where,
n is the total sample size
If
The table below gives the mean for the grouped data:
|
From |
To |
Frequency |
Mid-point | |
| 0 | 2 | 7 | 7 | |
| 2 | 4 | 42 | 126 | |
| 4 | 8 | 33 | 198 | |
| 8 | 16 | 21 | 252 | |
| 16 | 32 | 11 | 264 | |
| 32 | 64 | 6 | 288 | |
The mean for the grouped data is:
Substitute the values
Thus, the mean from the grouped data and frequencies is 9.458.
b.
Estimate the standard deviation from the grouped data and frequencies.
Answer to Problem 89CE
The standard deviation from the grouped data and frequencies is 10.855.
Explanation of Solution
Calculation:
The standard deviation for the grouped data is:
Where,
n is the total sample size
If
The table below gives the mean for the grouped data:
|
From |
To |
Frequency |
Mid-point | ||
| 0 | 2 | 7 | 500.78 | ||
| 2 | 4 | 42 | 1,751.642 | ||
| 4 | 8 | 33 | 394.606 | ||
| 8 | 16 | 21 | 135.697 | ||
| 16 | 32 | 11 | 2,326.17 | ||
| 32 | 64 | 6 | 8,912.915 | ||
The standard deviation for the grouped data is:
Substitute the values
Thus, the standard deviation from the grouped data and frequencies is 10.855.
c.
Decide whether the observations are distributed uniformly within each interval.
Answer to Problem 89CE
No, the observations are distributed uniformly within each interval.
Explanation of Solution
A careful inspection on the observation states that the lower frequency ranges are much greater than that of the higher ranges. Thus, it is clear that the normal curve will be skewed right. Most of the data values seemed to appear closer to the lower frequency range. The difference made in the estimate of the mean was caused due to the changes made in the midpoint. If the midpoint has equal weight than the estimate of mean would appear much low.
d.
Explain the reason for thinking that the bins used are of unequal sizes (interval width).
Explanation of Solution
The equal sizes of the bins in a histogram may not always allow the shape of the data to be represented accurately. Moreover, ensuring equal bins may produce one or more empty classes. This makes the histogram more difficult to interpret and is not desirable.
In this case, equal bins would have given rise to empty classes.
Hence, the bins used are of unequal sizes.
Want to see more full solutions like this?
Chapter 4 Solutions
APPLIED STAT.IN BUS.+ECONOMICS


- To: [Boss's Name] From: Nathaniel D Sain Date: 4/5/2025 Subject: Decision Analysis for Business Scenario Introduction to the Business Scenario Our delivery services business has been experiencing steady growth, leading to an increased demand for faster and more efficient deliveries. To meet this demand, we must decide on the best strategy to expand our fleet. The three possible alternatives under consideration are purchasing new delivery vehicles, leasing vehicles, or partnering with third-party drivers. The decision must account for various external factors, including fuel price fluctuations, demand stability, and competition growth, which we categorize as the states of nature. Each alternative presents unique advantages and challenges, and our goal is to select the most viable option using a structured decision-making approach. Alternatives and States of Nature The three alternatives for fleet expansion were chosen based on their cost implications, operational efficiency, and…arrow_forwardBusinessarrow_forwardWhy researchers are interested in describing measures of the center and measures of variation of a data set?arrow_forward
- WHAT IS THE SOLUTION?arrow_forwardThe following ordered data list shows the data speeds for cell phones used by a telephone company at an airport: A. Calculate the Measures of Central Tendency from the ungrouped data list. B. Group the data in an appropriate frequency table. C. Calculate the Measures of Central Tendency using the table in point B. 0.8 1.4 1.8 1.9 3.2 3.6 4.5 4.5 4.6 6.2 6.5 7.7 7.9 9.9 10.2 10.3 10.9 11.1 11.1 11.6 11.8 12.0 13.1 13.5 13.7 14.1 14.2 14.7 15.0 15.1 15.5 15.8 16.0 17.5 18.2 20.2 21.1 21.5 22.2 22.4 23.1 24.5 25.7 28.5 34.6 38.5 43.0 55.6 71.3 77.8arrow_forwardII Consider the following data matrix X: X1 X2 0.5 0.4 0.2 0.5 0.5 0.5 10.3 10 10.1 10.4 10.1 10.5 What will the resulting clusters be when using the k-Means method with k = 2. In your own words, explain why this result is indeed expected, i.e. why this clustering minimises the ESS map.arrow_forward
- why the answer is 3 and 10?arrow_forwardPS 9 Two films are shown on screen A and screen B at a cinema each evening. The numbers of people viewing the films on 12 consecutive evenings are shown in the back-to-back stem-and-leaf diagram. Screen A (12) Screen B (12) 8 037 34 7 6 4 0 534 74 1645678 92 71689 Key: 116|4 represents 61 viewers for A and 64 viewers for B A second stem-and-leaf diagram (with rows of the same width as the previous diagram) is drawn showing the total number of people viewing films at the cinema on each of these 12 evenings. Find the least and greatest possible number of rows that this second diagram could have. TIP On the evening when 30 people viewed films on screen A, there could have been as few as 37 or as many as 79 people viewing films on screen B.arrow_forwardQ.2.4 There are twelve (12) teams participating in a pub quiz. What is the probability of correctly predicting the top three teams at the end of the competition, in the correct order? Give your final answer as a fraction in its simplest form.arrow_forward
- The table below indicates the number of years of experience of a sample of employees who work on a particular production line and the corresponding number of units of a good that each employee produced last month. Years of Experience (x) Number of Goods (y) 11 63 5 57 1 48 4 54 5 45 3 51 Q.1.1 By completing the table below and then applying the relevant formulae, determine the line of best fit for this bivariate data set. Do NOT change the units for the variables. X y X2 xy Ex= Ey= EX2 EXY= Q.1.2 Estimate the number of units of the good that would have been produced last month by an employee with 8 years of experience. Q.1.3 Using your calculator, determine the coefficient of correlation for the data set. Interpret your answer. Q.1.4 Compute the coefficient of determination for the data set. Interpret your answer.arrow_forwardCan you answer this question for mearrow_forwardTechniques QUAT6221 2025 PT B... TM Tabudi Maphoru Activities Assessments Class Progress lIE Library • Help v The table below shows the prices (R) and quantities (kg) of rice, meat and potatoes items bought during 2013 and 2014: 2013 2014 P1Qo PoQo Q1Po P1Q1 Price Ро Quantity Qo Price P1 Quantity Q1 Rice 7 80 6 70 480 560 490 420 Meat 30 50 35 60 1 750 1 500 1 800 2 100 Potatoes 3 100 3 100 300 300 300 300 TOTAL 40 230 44 230 2 530 2 360 2 590 2 820 Instructions: 1 Corall dawn to tha bottom of thir ceraan urina se se tha haca nariad in archerca antarand cubmit Q Search ENG US 口X 2025/05arrow_forward
 Glencoe Algebra 1, Student Edition, 9780079039897...AlgebraISBN:9780079039897Author:CarterPublisher:McGraw Hill