
APPLIED STAT.IN BUS.+ECONOMICS
6th Edition
ISBN: 9781259957598
Author: DOANE
Publisher: RENT MCG
expand_more
expand_more
format_list_bulleted
Videos
Textbook Question
Chapter 4.3, Problem 29SE
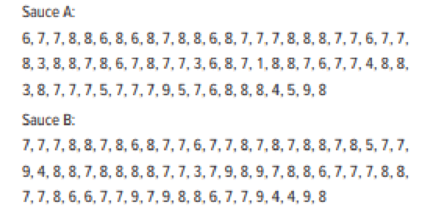
Noodles and Company tested consumer reaction to two spaghetti sauces. Each of 70 raters assessed both sauces on a scale of 1 (worst) to 10 (best) using several taste criteria. To correct for possible bias in tasting order, half the raters tasted Sauce A first, while the other half tasted Sauce B first. Actual results are shown below for “overall liking.” (a) Calculate the
Expert Solution & Answer

Trending nowThis is a popular solution!

Students have asked these similar questions
Business
https://www.hawkeslearning.com/Statistics/dbs2/datasets.html
NC Current Students - North Ce X | NC Canvas Login Links - North ( X
Final Exam Comprehensive x Cengage Learning
x
WASTAT - Final Exam - STAT
→
C
webassign.net/web/Student/Assignment-Responses/submit?dep=36055360&tags=autosave#question3659890_9
Part (b)
Draw a scatter plot of the ordered pairs.
N
Life
Expectancy
Life
Expectancy
80
70
600
50
40
30
20
10
Year of
1950
1970 1990
2010 Birth
O
Life
Expectancy
Part (c)
800
70
60
50
40
30
20
10
1950
1970 1990
W
ALT
林
$
#
4
R
J7
Year of
2010 Birth
F6
4+
80
70
60
50
40
30
20
10
Year of
1950 1970 1990
2010 Birth
Life
Expectancy
Ox
800
70
60
50
40
30
20
10
Year of
1950 1970 1990 2010 Birth
hp
P.B.
KA
&
7
80
% 5
H
A
B
F10
711
N
M
K
744
PRT SC
ALT
CTRL
Chapter 4 Solutions
APPLIED STAT.IN BUS.+ECONOMICS
Ch. 4.2 - (a) For each data set, find the mean, median, and...Ch. 4.2 - For each data set, is the mode a good measure of...Ch. 4.2 - For each data set, is the mode a good measure of...Ch. 4.2 - For each data set, which best indicates a typical...Ch. 4.2 - For each data set, which best indicates a typical...Ch. 4.2 - Days on the market are shown for the 36 most...Ch. 4.2 - Scores are shown for the most recent state civil...Ch. 4.2 - A vehicle emissions testing facility can process...Ch. 4.2 - CitiBank recorded the number of customers to use a...Ch. 4.2 - Prob. 10SE
Ch. 4.2 - Prob. 11SECh. 4.2 - Prob. 12SECh. 4.2 - (a) Write the Excel function for the 10 percent...Ch. 4.2 - Prob. 14SECh. 4.2 - Prob. 15SECh. 4.2 - Spirit Airlines kept track of the number of empty...Ch. 4.2 - CitiBank recorded the number of customers to use a...Ch. 4.2 - On Friday night, the owner of Chez Pierre in...Ch. 4.2 - Prob. 19SECh. 4.2 - The number of internet users in Latin America grew...Ch. 4.3 - (a) Find the mean and standard deviation for each...Ch. 4.3 - For each data set: (a) Find the mean. (b) Find the...Ch. 4.3 - In fuel economy tests in city driving conditions,...Ch. 4.3 - Over the past month, Bobs bowling score mean was...Ch. 4.3 - Prob. 25SECh. 4.3 - Prob. 26SECh. 4.3 - (a) Find the coefficient of variation for prices...Ch. 4.3 - Prob. 28SECh. 4.3 - Noodles and Company tested consumer reaction to...Ch. 4.4 - (a) By Chebyshevs Theorem, at least how many...Ch. 4.4 - An exam has a mean of 70 with a standard deviation...Ch. 4.4 - Prob. 32SECh. 4.4 - The mean collection period for accounts receivable...Ch. 4.4 - Convert each individual data value to a...Ch. 4.4 - Prob. 35SECh. 4.4 - Prob. 36SECh. 4.4 - Find the original data value corresponding to each...Ch. 4.4 - CitiBank recorded the number of customers to use a...Ch. 4.4 - Prob. 39SECh. 4.5 - Scores on an accounting exam ranged from 42 to 96,...Ch. 4.5 - In 2007, total compensation (in thousands of...Ch. 4.5 - Waiting times (minutes) for a table at Joeys BBQ...Ch. 4.5 - Coffee temperatures (degrees Fahrenheit) at a...Ch. 4.5 - Prob. 44SECh. 4.5 - On San Martin Boulevard, embedded sensors kept...Ch. 4.5 - Prob. 46SECh. 4.5 - Prob. 47SECh. 4.6 - For each X-Y data set (n = 12): (a) Make a scatter...Ch. 4.6 - Closing prices of two stocks are recorded for 50...Ch. 4.6 - Prob. 50SECh. 4.6 - Prob. 51SECh. 4.7 - Estimate the mean from this table of grouped data...Ch. 4.7 - Estimate the mean from the following table of...Ch. 4 - What are descriptive statistics? How do they...Ch. 4 - Explain each concept: (a) center, (b) variability,...Ch. 4 - Prob. 3CRCh. 4 - List strengths and weaknesses of each measure of...Ch. 4 - Prob. 5CRCh. 4 - (a) What is a bimodal distribution? (b) Explain...Ch. 4 - Prob. 7CRCh. 4 - Prob. 8CRCh. 4 - (a) Which standard deviation formula (population,...Ch. 4 - (a) To what kind of data does Chebyshevs Theorem...Ch. 4 - Prob. 11CRCh. 4 - Prob. 12CRCh. 4 - Prob. 13CRCh. 4 - Prob. 14CRCh. 4 - (a) Explain the method of medians for calculating...Ch. 4 - (a) What is a box plot? What does it tell us? (b)...Ch. 4 - Prob. 17CRCh. 4 - Prob. 18CRCh. 4 - Prob. 19CRCh. 4 - (a) What is kurtosis? (b) Sketch a platykurtic...Ch. 4 - Prob. 54CECh. 4 - If the mean asset turnover for retail firms is...Ch. 4 - Prob. 56CECh. 4 - During a rock concert, the noise level (in...Ch. 4 - Bags of jelly beans have a mean weight of 396 gm...Ch. 4 - Based on experience, the Ball Corporations...Ch. 4 - SAT scores for the entering class of 2010 at...Ch. 4 - Prob. 61CECh. 4 - The average time a Boulder High varsity lacrosse...Ch. 4 - Prob. 63CECh. 4 - Below are monthly rents paid by 30 students who...Ch. 4 - How many days in advance do travelers purchase...Ch. 4 - The durations (minutes) of 26 electric power...Ch. 4 - The U.S. Postal Service will ship a Priority Mail...Ch. 4 - Prob. 68CECh. 4 - Prob. 69CECh. 4 - Prob. 70CECh. 4 - Prob. 71CECh. 4 - A plumbing suppliers mean monthly demand for vinyl...Ch. 4 - Prob. 73CECh. 4 - Analysis of investment portfolio returns over a...Ch. 4 - Prob. 75CECh. 4 - Caffeine content in a 5-ounce cup of brewed coffee...Ch. 4 - Prob. 77CECh. 4 - Prob. 78CECh. 4 - Prob. 79CECh. 4 - Prob. 80CECh. 4 - Prob. 81CECh. 4 - Prob. 82CECh. 4 - Prob. 83CECh. 4 - The median waiting time for a liver transplant in...Ch. 4 - A small suburban community agreed to purchase...Ch. 4 - A companys contractual trigger point for a union...Ch. 4 - Prob. 87CECh. 4 - (a) Enter the Excel function...Ch. 4 - Note: In each of the following tables, the upper...Ch. 4 - This table shows the distribution of winning times...Ch. 4 - The self-reported number of hours worked per week...Ch. 4 - How long does it take to fly from Denver to...Ch. 4 - (a) Make an Excel scatter plot of X = 1990 assault...Ch. 4 - (a) Make an Excel scatter plot of X = airspeed...Ch. 4 - Prob. 97CECh. 4 - (a) Make an Excel scatter plot of X = weekly...Ch. 4 - Prob. 99CECh. 4 - Prob. 1ERQCh. 4 - Which is not an ethical obligation of a...Ch. 4 - Prob. 3ERQCh. 4 - Prob. 4ERQCh. 4 - Give the type of measurement (nominal, ordinal,...Ch. 4 - Prob. 6ERQCh. 4 - To choose a sample of 12 students from a...Ch. 4 - Which of the following is not a reason for...Ch. 4 - Which statement is correct? Why not the others? a....Ch. 4 - Prob. 10ERQCh. 4 - The management of a theme park obtained a random...Ch. 4 - Which one of the following is true? Why not the...Ch. 4 - Prob. 13ERQCh. 4 - Prob. 14ERQCh. 4 - Here are the ages of a random sample of 20 CEOs...Ch. 4 - Prob. 16ERQCh. 4 - Prob. 17ERQCh. 4 - Prob. 18ERQCh. 4 - Which is not a characteristic of using a log scale...
Knowledge Booster


Learn more about
Need a deep-dive on the concept behind this application? Look no further. Learn more about this topic, statistics and related others by exploring similar questions and additional content below.Similar questions
- Harvard University California Institute of Technology Massachusetts Institute of Technology Stanford University Princeton University University of Cambridge University of Oxford University of California, Berkeley Imperial College London Yale University University of California, Los Angeles University of Chicago Johns Hopkins University Cornell University ETH Zurich University of Michigan University of Toronto Columbia University University of Pennsylvania Carnegie Mellon University University of Hong Kong University College London University of Washington Duke University Northwestern University University of Tokyo Georgia Institute of Technology Pohang University of Science and Technology University of California, Santa Barbara University of British Columbia University of North Carolina at Chapel Hill University of California, San Diego University of Illinois at Urbana-Champaign National University of Singapore McGill…arrow_forwardName Harvard University California Institute of Technology Massachusetts Institute of Technology Stanford University Princeton University University of Cambridge University of Oxford University of California, Berkeley Imperial College London Yale University University of California, Los Angeles University of Chicago Johns Hopkins University Cornell University ETH Zurich University of Michigan University of Toronto Columbia University University of Pennsylvania Carnegie Mellon University University of Hong Kong University College London University of Washington Duke University Northwestern University University of Tokyo Georgia Institute of Technology Pohang University of Science and Technology University of California, Santa Barbara University of British Columbia University of North Carolina at Chapel Hill University of California, San Diego University of Illinois at Urbana-Champaign National University of Singapore…arrow_forwardA company found that the daily sales revenue of its flagship product follows a normal distribution with a mean of $4500 and a standard deviation of $450. The company defines a "high-sales day" that is, any day with sales exceeding $4800. please provide a step by step on how to get the answers in excel Q: What percentage of days can the company expect to have "high-sales days" or sales greater than $4800? Q: What is the sales revenue threshold for the bottom 10% of days? (please note that 10% refers to the probability/area under bell curve towards the lower tail of bell curve) Provide answers in the yellow cellsarrow_forward
- Find the critical value for a left-tailed test using the F distribution with a 0.025, degrees of freedom in the numerator=12, and degrees of freedom in the denominator = 50. A portion of the table of critical values of the F-distribution is provided. Click the icon to view the partial table of critical values of the F-distribution. What is the critical value? (Round to two decimal places as needed.)arrow_forwardA retail store manager claims that the average daily sales of the store are $1,500. You aim to test whether the actual average daily sales differ significantly from this claimed value. You can provide your answer by inserting a text box and the answer must include: Null hypothesis, Alternative hypothesis, Show answer (output table/summary table), and Conclusion based on the P value. Showing the calculation is a must. If calculation is missing,so please provide a step by step on the answers Numerical answers in the yellow cellsarrow_forwardShow all workarrow_forward
arrow_back_ios
SEE MORE QUESTIONS
arrow_forward_ios
Recommended textbooks for you
 Glencoe Algebra 1, Student Edition, 9780079039897...AlgebraISBN:9780079039897Author:CarterPublisher:McGraw Hill
 Big Ideas Math A Bridge To Success Algebra 1: Stu...AlgebraISBN:9781680331141Author:HOUGHTON MIFFLIN HARCOURTPublisher:Houghton Mifflin Harcourt
Glencoe Algebra 1, Student Edition, 9780079039897...
Algebra
ISBN:9780079039897
Author:Carter
Publisher:McGraw Hill
Big Ideas Math A Bridge To Success Algebra 1: Stu...
Algebra
ISBN:9781680331141
Author:HOUGHTON MIFFLIN HARCOURT
Publisher:Houghton Mifflin Harcourt
Hypothesis Testing using Confidence Interval Approach; Author: BUM2413 Applied Statistics UMP;https://www.youtube.com/watch?v=Hq1l3e9pLyY;License: Standard YouTube License, CC-BY
Hypothesis Testing - Difference of Two Means - Student's -Distribution & Normal Distribution; Author: The Organic Chemistry Tutor;https://www.youtube.com/watch?v=UcZwyzwWU7o;License: Standard Youtube License