
Concept explainers
Videos
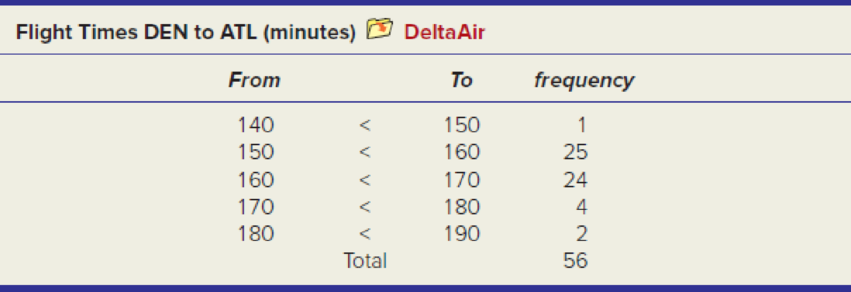
How long does it take to fly from Denver to Atlanta on Delta Airlines? The table below shows 56 observations on flight times (in minutes) for the first week of March 2005. (a) Use the grouped data formula to estimate the
(Source: www.bts.gov.)
a.
Estimate the mean, standard deviation from the grouped data and frequencies.
Answer to Problem 92CE
The mean, standard deviation from the grouped data and frequencies is:
| Measures | Values |
| Mean | 161.61 |
| Standard deviation | 7.93 |
Explanation of Solution
Calculation:
The given information is about the observation of flight times for the first week for 56 weeks.
The mean for the grouped data is:
The standard deviation for the grouped data is:
Where,
n is the total sample size
If
The table below gives the mean for the grouped data:
|
From |
To |
Frequency |
Mid-point | |||
| 140 | 150 | 1 | 145 | 275.89 | ||
| 150 | 160 | 25 | 3875 | 1,092.25 | ||
| 160 | 170 | 24 | 3960 | 275.76 | ||
| 170 | 180 | 4 | 700 | 717.16 | ||
| 180 | 190 | 2 | 370 | 1,094.18 | ||
The mean for the grouped data is:
Substitute the values
Thus, the mean from the grouped data and frequencies is 161.61.
The standard deviation for the grouped data is:
Substitute the values
Thus, the standard deviation from the grouped data and frequencies is 7.93.
b.
Explain how the value of grouped estimate appeared closer to the ungrouped estimate.
Explanation of Solution
It is given that the value of ungrouped sample mean is 161.63 and ungrouped standard deviation is 8.07 minutes.
From the previous part (a), the value of grouped sample mean is 161.61 and grouped standard deviation is 7.93 minutes.
By the observing the value of grouped observation, the measures appear little bit nearer to ungrouped values.
c.
Explain the reason that the flight times for the second and third interval is not distributed uniformly.
Explanation of Solution
A careful inspection on the observation states that the distribution of the flight timings within the class interval 150-160 may be skewed to right with many more observation appear nearer to 160 and the distribution of the flight timings within the class interval 160-170 may be skewed to left with many more observation appear nearer to 160. The observation has a peculiar shape in its distribution. Thus, the shape of the distribution will be like slightly normal or somewhat skewed to right.
Want to see more full solutions like this?
Chapter 4 Solutions
APPLIED STAT.IN BUS.+ECONOMICS


- Harvard University California Institute of Technology Massachusetts Institute of Technology Stanford University Princeton University University of Cambridge University of Oxford University of California, Berkeley Imperial College London Yale University University of California, Los Angeles University of Chicago Johns Hopkins University Cornell University ETH Zurich University of Michigan University of Toronto Columbia University University of Pennsylvania Carnegie Mellon University University of Hong Kong University College London University of Washington Duke University Northwestern University University of Tokyo Georgia Institute of Technology Pohang University of Science and Technology University of California, Santa Barbara University of British Columbia University of North Carolina at Chapel Hill University of California, San Diego University of Illinois at Urbana-Champaign National University of Singapore McGill…arrow_forwardName Harvard University California Institute of Technology Massachusetts Institute of Technology Stanford University Princeton University University of Cambridge University of Oxford University of California, Berkeley Imperial College London Yale University University of California, Los Angeles University of Chicago Johns Hopkins University Cornell University ETH Zurich University of Michigan University of Toronto Columbia University University of Pennsylvania Carnegie Mellon University University of Hong Kong University College London University of Washington Duke University Northwestern University University of Tokyo Georgia Institute of Technology Pohang University of Science and Technology University of California, Santa Barbara University of British Columbia University of North Carolina at Chapel Hill University of California, San Diego University of Illinois at Urbana-Champaign National University of Singapore…arrow_forwardA company found that the daily sales revenue of its flagship product follows a normal distribution with a mean of $4500 and a standard deviation of $450. The company defines a "high-sales day" that is, any day with sales exceeding $4800. please provide a step by step on how to get the answers in excel Q: What percentage of days can the company expect to have "high-sales days" or sales greater than $4800? Q: What is the sales revenue threshold for the bottom 10% of days? (please note that 10% refers to the probability/area under bell curve towards the lower tail of bell curve) Provide answers in the yellow cellsarrow_forward
- Find the critical value for a left-tailed test using the F distribution with a 0.025, degrees of freedom in the numerator=12, and degrees of freedom in the denominator = 50. A portion of the table of critical values of the F-distribution is provided. Click the icon to view the partial table of critical values of the F-distribution. What is the critical value? (Round to two decimal places as needed.)arrow_forwardA retail store manager claims that the average daily sales of the store are $1,500. You aim to test whether the actual average daily sales differ significantly from this claimed value. You can provide your answer by inserting a text box and the answer must include: Null hypothesis, Alternative hypothesis, Show answer (output table/summary table), and Conclusion based on the P value. Showing the calculation is a must. If calculation is missing,so please provide a step by step on the answers Numerical answers in the yellow cellsarrow_forwardShow all workarrow_forward
 Glencoe Algebra 1, Student Edition, 9780079039897...AlgebraISBN:9780079039897Author:CarterPublisher:McGraw Hill
 Big Ideas Math A Bridge To Success Algebra 1: Stu...AlgebraISBN:9781680331141Author:HOUGHTON MIFFLIN HARCOURTPublisher:Houghton Mifflin Harcourt
 Holt Mcdougal Larson Pre-algebra: Student Edition...AlgebraISBN:9780547587776Author:HOLT MCDOUGALPublisher:HOLT MCDOUGAL
 College Algebra (MindTap Course List)AlgebraISBN:9781305652231Author:R. David Gustafson, Jeff HughesPublisher:Cengage Learning