
Concept explainers
Videos
(a)
To explain: the linear function appear to be positive or negative.
(a)
Answer to Problem 38E
The y -intercept of the graph of linear function appear to be negative.
Explanation of Solution
Given:
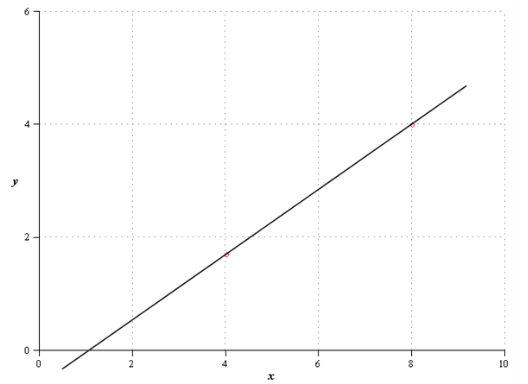
Consider the graph shows two points that lie on the graph of a linear function
Calculation:
Draw the line joining the two points on the graph.
As from the graph line is a cut the y axis below the x axis.
So, the y -intercept of the graph of linear function appear to be negative.
Conclusion:
Therefore, the y -intercept of the graph of linear function appear to be negative.
(b)
To estimate: the coordinates of the two points and use your estimates to confirm your answer in part (a).
(b)
Answer to Problem 38E
The estimate of the point coordinates are confirm.
Explanation of Solution
Calculation:
Estimate the coordinates of the points
From the graph the coordinates of the points are
Now, to confirm the estimate of the point coordinates, use these points and find the slope
Now, use the slope
Add 4 on both sides
Now, from the equation it is clear that the y -intercept is negative
Conclusion:
Therefore, the estimate of the point coordinates are confirm.
Chapter 4 Solutions
BIG IDEAS MATH Integrated Math 1: Student Edition 2016


- You have been hired as an intern to run analyses on the data and report the results back to Sarah; the five questions that Sarah needs you to address are given below. Does there appear to be a positive or negative relationship between price and screen size? Use a scatter plot to examine the relationship. Determine and interpret the correlation coefficient between the two variables. In your interpretation, discuss the direction of the relationship (positive, negative, or zero relationship). Also discuss the strength of the relationship. Estimate the relationship between screen size and price using a simple linear regression model and interpret the estimated coefficients. (In your interpretation, tell the dollar amount by which price will change for each unit of increase in screen size). Include the manufacturer dummy variable (Samsung=1, 0 otherwise) and estimate the relationship between screen size, price and manufacturer dummy as a multiple linear regression model. Interpret the…arrow_forwardDoes there appear to be a positive or negative relationship between price and screen size? Use a scatter plot to examine the relationship. How to take snapshots: if you use a MacBook, press Command+ Shift+4 to take snapshots. If you are using Windows, use the Snipping Tool to take snapshots. Question 1: Determine and interpret the correlation coefficient between the two variables. In your interpretation, discuss the direction of the relationship (positive, negative, or zero relationship). Also discuss the strength of the relationship. Value of correlation coefficient: Direction of the relationship (positive, negative, or zero relationship): Strength of the relationship (strong/moderate/weak): Question 2: Estimate the relationship between screen size and price using a simple linear regression model and interpret the estimated coefficients. In your interpretation, tell the dollar amount by which price will change for each unit of increase in screen size. (The answer for the…arrow_forwardTri-County Utilities, Inc., supplies natural gas to customers in a three-county area. The company purchases natural gas from two companies: Southern Gas and Northwest Gas. Demand forecasts for the coming winter season are as follows: Hamilton County, 400 units; Butler County, 200 units; and Clermont County, 300 units. Contracts to provide the following quantities have been written: Southern Gas, 500 units; and Northwest Gas, 400 units. Distribution costs for the counties vary, depending upon the location of the suppliers. The distribution costs per unit (in thousands of dollars) are as follows. From To Hamilton Butler Clermont Southern Gas 10 20 15 Northwest Gas 12 15 18 (a) Develop a network representation of this problem. (Submit a file with a maximum size of 1 MB.) Choose File No file chosen Assignment 3 graph.docx Score: 1 out of 1 Comment: (b) Develop a linear programming model that can be used to determine the plan that will minimize total distribution costs (in thousands of…arrow_forward
- Use the method of undetermined coefficients to solve the given nonhomogeneous system. dx dt = 2x + 3y − 8 dy dt = −x − 2y + 6 X(t) =arrow_forwardAs discussed in Section 8.3, the Markowitz model uses the variance of the portfolio as the measure of risk. However, variance includes deviations both below and above the mean return. Semivariance includes only deviations below the mean and is considered by many to be a better measure of risk. (a) Develop a model that minimizes semivariance for the Hauck Financial data given in the file HauckData with a required return of 10%. Assume that the five planning scenarios in the Hauck Financial Services model are equally likely to occur. Hint: Modify model (8.10)–(8.19). Define a variable ds for each scenario and let ds ≥ R − Rs with ds ≥ 0. Then make the objective function: Min 1 5 5 s = 1 ds2. Let FS = proportion of portfolio invested in the foreign stock mutual fund IB = proportion of portfolio invested in the intermediate-term bond fund LG = proportion of portfolio invested in the large-cap growth fund LV = proportion of portfolio invested in the large-cap value fund…arrow_forwardCalculus lll May I please have the blank lines completed, and final statement defined as a result? Thank you for the support!arrow_forward
- For each month of the year, Taylor collected the average high temperatures in Jackson, Mississippi. He used the data to create the histogram shown. Which set of data did he use to create the histogram? A 55, 60, 64, 72, 73, 75, 77, 81, 83, 91, 91, 92\ 55,\ 60,\ 64,\ 72,\ 73,\ 75,\ 77,\ 81,\ 83,\ 91,\ 91,\ 92 55, 60, 64, 72, 73, 75, 77, 81, 83, 91, 91, 92 B 55, 57, 60, 65, 70, 71, 78, 79, 85, 86, 88, 91\ 55,\ 57,\ 60,\ 65,\ 70,\ 71,\ 78,\ 79,\ 85,\ 86,\ 88,\ 91 55, 57, 60, 65, 70, 71, 78, 79, 85, 86, 88, 91 C 55, 60, 63, 64, 65, 71, 83, 87, 88, 88, 89, 93\ 55,\ 60,\ 63,\ 64,\ 65,\ 71,\ 83,\ 87,\ 88,\ 88,\ 89,\ 93 55, 60, 63, 64, 65, 71, 83, 87, 88, 88, 89, 93 D 55, 58, 60, 66, 68, 75, 77, 82, 86, 89, 91, 91\ 55,\ 58,\ 60,\ 66,\ 68,\ 75,\ 77,\ 82,\ 86,\ 89,\ 91,\ 91 55, 58, 60, 66, 68, 75, 77, 82, 86, 89, 91, 91arrow_forwardIn this problem, we consider a Brownian motion (W+) t≥0. We consider a stock model (St)t>0 given (under the measure P) by d.St 0.03 St dt + 0.2 St dwt, with So 2. We assume that the interest rate is r = 0.06. The purpose of this problem is to price an option on this stock (which we name cubic put). This option is European-type, with maturity 3 months (i.e. T = 0.25 years), and payoff given by F = (8-5)+ (a) Write the Stochastic Differential Equation satisfied by (St) under the risk-neutral measure Q. (You don't need to prove it, simply give the answer.) (b) Give the price of a regular European put on (St) with maturity 3 months and strike K = 2. (c) Let X = S. Find the Stochastic Differential Equation satisfied by the process (Xt) under the measure Q. (d) Find an explicit expression for X₁ = S3 under measure Q. (e) Using the results above, find the price of the cubic put option mentioned above. (f) Is the price in (e) the same as in question (b)? (Explain why.)arrow_forwardProblem 4. Margrabe formula and the Greeks (20 pts) In the homework, we determined the Margrabe formula for the price of an option allowing you to swap an x-stock for a y-stock at time T. For stocks with initial values xo, yo, common volatility σ and correlation p, the formula was given by Fo=yo (d+)-x0Þ(d_), where In (±² Ꭲ d+ õ√T and σ = σ√√√2(1 - p). дго (a) We want to determine a "Greek" for ỡ on the option: find a formula for θα (b) Is дго θα positive or negative? (c) We consider a situation in which the correlation p between the two stocks increases: what can you say about the price Fo? (d) Assume that yo< xo and p = 1. What is the price of the option?arrow_forward
- The Course Name Real Analysis please Solve questions by Real Analysisarrow_forwardWe consider a 4-dimensional stock price model given (under P) by dẴ₁ = µ· Xt dt + йt · ΣdŴt where (W) is an n-dimensional Brownian motion, π = (0.02, 0.01, -0.02, 0.05), 0.2 0 0 0 0.3 0.4 0 0 Σ= -0.1 -4a За 0 0.2 0.4 -0.1 0.2) and a E R. We assume that ☑0 = (1, 1, 1, 1) and that the interest rate on the market is r = 0.02. (a) Give a condition on a that would make stock #3 be the one with largest volatility. (b) Find the diversification coefficient for this portfolio as a function of a. (c) Determine the maximum diversification coefficient d that you could reach by varying the value of a? 2arrow_forwardQuestion 1. Your manager asks you to explain why the Black-Scholes model may be inappro- priate for pricing options in practice. Give one reason that would substantiate this claim? Question 2. We consider stock #1 and stock #2 in the model of Problem 2. Your manager asks you to pick only one of them to invest in based on the model provided. Which one do you choose and why ? Question 3. Let (St) to be an asset modeled by the Black-Scholes SDE. Let Ft be the price at time t of a European put with maturity T and strike price K. Then, the discounted option price process (ert Ft) t20 is a martingale. True or False? (Explain your answer.) Question 4. You are considering pricing an American put option using a Black-Scholes model for the underlying stock. An explicit formula for the price doesn't exist. In just a few words (no more than 2 sentences), explain how you would proceed to price it. Question 5. We model a short rate with a Ho-Lee model drt = ln(1+t) dt +2dWt. Then the interest rate…arrow_forward
 Discrete Mathematics and Its Applications ( 8th I...MathISBN:9781259676512Author:Kenneth H RosenPublisher:McGraw-Hill Education
 Mathematics for Elementary Teachers with Activiti...MathISBN:9780134392790Author:Beckmann, SybillaPublisher:PEARSON
 Thinking Mathematically (7th Edition)MathISBN:9780134683713Author:Robert F. BlitzerPublisher:PEARSON
 Discrete Mathematics With ApplicationsMathISBN:9781337694193Author:EPP, Susanna S.Publisher:Cengage Learning,
 Pathways To Math Literacy (looseleaf)MathISBN:9781259985607Author:David Sobecki Professor, Brian A. MercerPublisher:McGraw-Hill Education