
Concept explainers
Videos
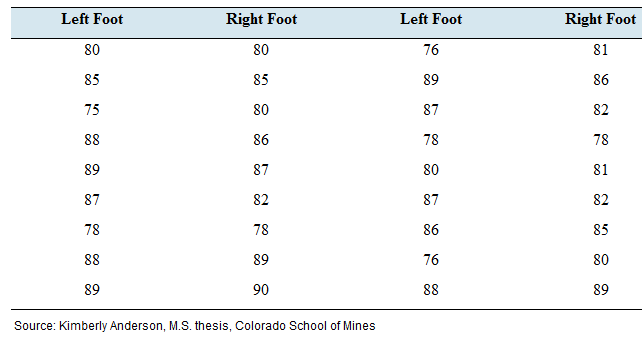
Foot temperatures: Foot ulcers are a common problem for people with diabetes. Higher skin temperatures on the foot indicate an increased risk of ulcers. In a study carried out at the Colorado School of Mines, skin temperatures on both feet were measured, in degrees Fahrenheit, for 18 diabetic patients. The results are presented in the following table.
- Compute due least-squares regression line for predicting right foot temperature from the left foot temperature.
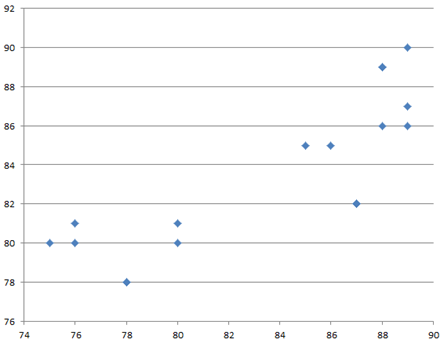
- Construct a scatter-plot (y) versus the left foot temperature Graph the least-squares regression line on the same axes.
- If the left foot temperatures of two patients differ by 2 degrees: by how much would you predict their right foot temperatures to differ?
- Predict the right foot temperature for a patient whose left foot temperature is 81 degrees.
a.
To find: The least-square regression line for the given data set.
Answer to Problem 25E
The least square regression line of the given data set is,
Explanation of Solution
The foot temperature of both foots are measured of
Calculation:
The least-square regression is given by the formula,
Where
The correlation coefficient is given by the formula,
Supposing the variable

Using the data above, Minitab, the correlation coefficient can be obtained by the following table.
Hence, the correlation coefficient is,
Then, the coefficient
Therefore,
Conclusion:
The least square regression line is found to be,
b.
To graph:The scatter plot for the given data.
Explanation of Solution
Graph:
The scatter plot for the given data can be constructed by considering the temperature of left foot as
Interpretation:
Out of all these
c.
To find:The temperature change of right foot for a change of
Answer to Problem 25E
An increase of
Explanation of Solution
Given:
The least-square regression line has been obtained as
Calculation:
Let
Then the corresponding prediction for the right foot temperature for
Also, for
The second relationship can be simplified as follows.
The difference of these two predicted values gives the change of the right foot temperature for
Conclusion:
Therefore, an increase of
d.
To find: The predicted right foot temperature when the left foot is in
Answer to Problem 25E
The predicted right foot temperature is
Explanation of Solution
Given:
The formula of the least square regression has been determined as
Calculation:
When the temperature of the left foot is
Conclusion:
Therefore, the predicted right foot temperature is
Want to see more full solutions like this?
Chapter 4 Solutions
Elementary Statistics 2nd Edition


- Harvard University California Institute of Technology Massachusetts Institute of Technology Stanford University Princeton University University of Cambridge University of Oxford University of California, Berkeley Imperial College London Yale University University of California, Los Angeles University of Chicago Johns Hopkins University Cornell University ETH Zurich University of Michigan University of Toronto Columbia University University of Pennsylvania Carnegie Mellon University University of Hong Kong University College London University of Washington Duke University Northwestern University University of Tokyo Georgia Institute of Technology Pohang University of Science and Technology University of California, Santa Barbara University of British Columbia University of North Carolina at Chapel Hill University of California, San Diego University of Illinois at Urbana-Champaign National University of Singapore McGill…arrow_forwardName Harvard University California Institute of Technology Massachusetts Institute of Technology Stanford University Princeton University University of Cambridge University of Oxford University of California, Berkeley Imperial College London Yale University University of California, Los Angeles University of Chicago Johns Hopkins University Cornell University ETH Zurich University of Michigan University of Toronto Columbia University University of Pennsylvania Carnegie Mellon University University of Hong Kong University College London University of Washington Duke University Northwestern University University of Tokyo Georgia Institute of Technology Pohang University of Science and Technology University of California, Santa Barbara University of British Columbia University of North Carolina at Chapel Hill University of California, San Diego University of Illinois at Urbana-Champaign National University of Singapore…arrow_forwardA company found that the daily sales revenue of its flagship product follows a normal distribution with a mean of $4500 and a standard deviation of $450. The company defines a "high-sales day" that is, any day with sales exceeding $4800. please provide a step by step on how to get the answers in excel Q: What percentage of days can the company expect to have "high-sales days" or sales greater than $4800? Q: What is the sales revenue threshold for the bottom 10% of days? (please note that 10% refers to the probability/area under bell curve towards the lower tail of bell curve) Provide answers in the yellow cellsarrow_forward
- Find the critical value for a left-tailed test using the F distribution with a 0.025, degrees of freedom in the numerator=12, and degrees of freedom in the denominator = 50. A portion of the table of critical values of the F-distribution is provided. Click the icon to view the partial table of critical values of the F-distribution. What is the critical value? (Round to two decimal places as needed.)arrow_forwardA retail store manager claims that the average daily sales of the store are $1,500. You aim to test whether the actual average daily sales differ significantly from this claimed value. You can provide your answer by inserting a text box and the answer must include: Null hypothesis, Alternative hypothesis, Show answer (output table/summary table), and Conclusion based on the P value. Showing the calculation is a must. If calculation is missing,so please provide a step by step on the answers Numerical answers in the yellow cellsarrow_forwardShow all workarrow_forward
 Big Ideas Math A Bridge To Success Algebra 1: Stu...AlgebraISBN:9781680331141Author:HOUGHTON MIFFLIN HARCOURTPublisher:Houghton Mifflin Harcourt
 Linear Algebra: A Modern IntroductionAlgebraISBN:9781285463247Author:David PoolePublisher:Cengage Learning
 Glencoe Algebra 1, Student Edition, 9780079039897...AlgebraISBN:9780079039897Author:CarterPublisher:McGraw Hill
 Functions and Change: A Modeling Approach to Coll...AlgebraISBN:9781337111348Author:Bruce Crauder, Benny Evans, Alan NoellPublisher:Cengage Learning
 Elementary Linear Algebra (MindTap Course List)AlgebraISBN:9781305658004Author:Ron LarsonPublisher:Cengage Learning
 College AlgebraAlgebraISBN:9781305115545Author:James Stewart, Lothar Redlin, Saleem WatsonPublisher:Cengage Learning