Elementary Statistics 2nd Edition
2nd Edition
ISBN: 9781259724275
Author: William Navidi, Barry Monk
Publisher: McGraw-Hill Education
bartleby

Concept explainers

bartleby

Videos

Textbook Question
Book Icon
Chapter 4, Problem 2CS

The following table, Reproduce from chapter introduction. Presents the inflation rate and unemployment rate, both in percent, for the years 1985-2012

Chapter 4, Problem 2CS, The following table, Reproduce from chapter introduction. Presents the inflation rate and

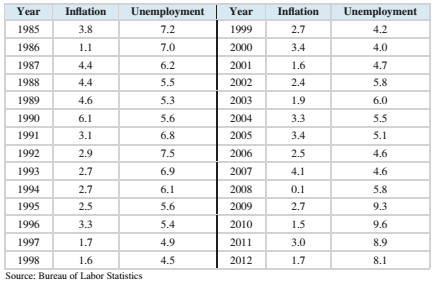
We will investigate some methods for predicting unemployment first. We will try to predict the unemployment rate from the inflation rate.

Compute the least-squares line for predicting unemployment from inflation.

Expert Solution & Answer
Check Mark
To determine

To calculate: To compute the least squares regression line for the given data set.

Answer to Problem 2CS

  y=0.199x+6.6594

Explanation of Solution

Given information:

The following table presents the inflation rate and unemployment rate, both in percent, for the years 1985-2012.

    YearInflationUnemployment
    19853.87.2
    19861.17.0
    19874.46.2
    19884.45.5
    19894.65.3
    19906.15.6
    19913.16.8
    19922.97.5
    19932.76.9
    19942.76.1
    19952.55.6
    19963.35.4
    19971.74.9
    19981.64.5
    19992.74.2
    20003.44.0
    20011.64.7
    20022.45.8
    20031.96.0
    20043.35.5
    20053.45.1
    20062.54.6
    20074.14.6
    20080.15.8
    20092.79.3
    20101.59.6
    20113.08.9
    20121.78.1

Formula Used:

The equation for least-square regression line:

  y=b0+b1x

Where b1=rsysx is the slope and b0=y¯b1x¯ is the y -intercept.

The correlation coefficient of a data is given by:

  r=1n( x x ¯ )( y y ¯ )sxsy

Where,

  x¯,y¯ represent the mean of x and y respectively. sx,sy represent the standard deviations of x and y . n represents the number of terms.

The standard deviations are given by:

  sx= ( x x ¯ ) 2 n,sy= ( y y ¯ ) 2 n

The mean of x is given by:

  x¯=xn

The mean of y is given by:

  y¯=yn

Calculation:

The mean of x is given by:

  x¯=xn= 3.8+1.1+4.4+4.4+4.6+6.1+3.1+2.9+2.7+2.7+2.5+3.3+1.7+1.6+ 2.7+3.4+1.6+2.4+1.9+3.3+3.4+2.5+4.1+0.1+2.7+1.5+3.0+1.728x¯=xn=79.2028=2.82857

The mean of y is given by:

  y¯=yn= 7.2+7.0+6.2+5.5+5.3+5.6+6.8+7.5+6.9+6.1+5.6+5.4+4.9+4.5+ 4.2+4.0+4.7+5.8+6.0+5.5+5.1+4.6+4.6+5.8+9.3+9.6+8.9+8.128y¯=yn=170.728=6.09643

The data can be represented in tabular form as:

    x y Elementary Statistics 2nd Edition, Chapter 4, Problem 2CS , additional homework tip  1Elementary Statistics 2nd Edition, Chapter 4, Problem 2CS , additional homework tip  2Elementary Statistics 2nd Edition, Chapter 4, Problem 2CS , additional homework tip  3Elementary Statistics 2nd Edition, Chapter 4, Problem 2CS , additional homework tip  4
    3.87.20.971430.943671.103571.21787
    1.17.0-1.728572.987960.903570.81644
    4.46.21.571432.469390.103570.01073
    4.45.51.571432.46939-0.596430.35573
    4.65.31.771433.13796-0.796430.63430
    6.15.63.2714310.70224-0.496430.24644
    3.16.80.271430.073670.703570.49501
    2.97.50.071430.005101.403571.97001
    2.76.9-0.128570.016530.803570.64573
    2.76.1-0.128570.016530.003570.00001
    2.55.6-0.328570.10796-0.496430.24644
    3.35.40.471430.22224-0.696430.48501
    1.74.9-1.128571.27367-1.196431.43144
    1.64.5-1.228571.50939-1.596432.54858
    2.74.2-0.128570.01653-1.896433.59644
    3.44.00.571430.32653-2.096434.39501
    1.64.7-1.228571.50939-1.396431.95001
    2.45.8-0.428570.18367-0.296430.08787
    1.96.0-0.928570.86224-0.096430.00930
    3.35.50.471430.22224-0.596430.35573
    3.45.10.571430.32653-0.996430.99287
    2.54.6-0.328570.10796-1.496432.23930
    4.14.61.271431.61653-1.496432.23930
    0.15.8-2.728577.44510-0.296430.08787
    2.79.3-0.128570.016533.2035710.26287
    1.59.6-1.328571.765103.5035712.27501
    3.08.90.171430.029392.803577.86001
    1.78.1-1.128571.273672.003574.01430
    x¯=2.82857y¯=6.09643 ( x x ¯ )2=41.63714 ( y y ¯ )2=61.46964

Hence, the standard deviation is given by:

  sx= ( x x ¯ ) 2 nsx= 41.63714 28sx=1.48704

And,

  sy= ( y y ¯ ) 2 nsy= 61.46964 28sy=2.19534

Consider, r=1n( x x ¯ )( y y ¯ )sxsy

Hence, the table for calculating coefficient of correlation is given by:

    x y Elementary Statistics 2nd Edition, Chapter 4, Problem 2CS , additional homework tip  5Elementary Statistics 2nd Edition, Chapter 4, Problem 2CS , additional homework tip  6Elementary Statistics 2nd Edition, Chapter 4, Problem 2CS , additional homework tip  7
    3.87.20.971431.103571.07204
    1.17.0-1.728570.90357-1.56189
    4.46.21.571430.103570.16276
    4.45.51.57143-0.59643-0.93724
    4.65.31.77143-0.79643-1.41082
    6.15.63.27143-0.49643-1.62403
    3.16.80.271430.703570.19097
    2.97.50.071431.403570.10026
    2.76.9-0.128570.80357-0.10332
    2.76.1-0.128570.00357-0.00046
    2.55.6-0.32857-0.496430.16311
    3.35.40.47143-0.69643-0.32832
    1.74.9-1.12857-1.196431.35026
    1.64.5-1.22857-1.596431.96133
    2.74.2-0.12857-1.896430.24383
    3.44.00.57143-2.09643-1.19796
    1.64.7-1.22857-1.396431.71561
    2.45.8-0.42857-0.296430.12704
    1.96.0-0.92857-0.096430.08954
    3.35.50.47143-0.59643-0.28117
    3.45.10.57143-0.99643-0.56939
    2.54.6-0.32857-1.496430.49168
    4.14.61.27143-1.49643-1.90260
    0.15.8-2.72857-0.296430.80883
    2.79.3-0.128573.20357-0.41189
    1.59.6-1.328573.50357-4.65474
    3.08.90.171432.803570.48061
    1.78.1-1.128572.00357-2.26117
    x¯=2.82857y¯=6.09643( x x ¯ )( y y ¯ )=8.28714

Plugging the values in the formula,

  r=1n ( x x ¯ )( y y ¯ )sxsyr=1288.28714( 1.48704 )( 2.19534 )r=0.16381

Plugging the values to obtain b1 ,

  b1=rsysxb1=1288.28714( 1.48704 )( 2.19534 )( 2.19534 )( 1.48704 )b1=0.1990

Plugging the values to obtain b0 ,

  b0=y¯b1x¯b0=(6.09643)(0.1990)(2.82857)b0=6.6594

Hence, the least-square regression line is given by:

  y=b0+b1xy=(6.6594)+(0.1990)xy=0.199x+6.6594

Therefore, the least squares regression line for the given data set is y=0.199x+6.6594

Want to see more full solutions like this?

Subscribe now to access step-by-step solutions to millions of textbook problems written by subject matter experts!
Students have asked these similar questions
The accompanying data shows the fossil fuels​ production, fossil fuels​ consumption, and total energy consumption in quadrillions of BTUs of a certain region for the years 1986 to 2015. Complete parts a and b. Year    Fossil Fuels Production    Fossil Fuels Consumption    Total Energy Consumption1949    28.748    29.002    31.9821950    32.563    31.632    34.6161951    35.792    34.008    36.9741952    34.977    33.800    36.7481953    35.349    34.826    37.6641954    33.764    33.877    36.6391955    37.364    37.410    40.2081956    39.771    38.888    41.7541957    40.133    38.926    41.7871958    37.216    38.717    41.6451959    39.045    40.550    43.4661960    39.869    42.137    45.0861961    40.307    42.758    45.7381962    41.732    44.681    47.8261963    44.037    46.509    49.6441964    45.789    48.543    51.8151965    47.235    50.577    54.0151966    50.035    53.514    57.0141967    52.597    55.127    58.9051968    54.306    58.502    62.4151969    56.286…
The accompanying data shows the fossil fuels​ production, fossil fuels​ consumption, and total energy consumption in quadrillions of BTUs of a certain region for the years 1986 to 2015. Complete parts a and b. Develop line charts for each variable and identify the characteristics of the time series​ (that is,​ random, stationary,​ trend, seasonal, or​ cyclical).   What is the line chart for the variable Fossil Fuels​ Production?
The accompanying data shows the fossil fuels​ production, fossil fuels​ consumption, and total energy consumption in quadrillions of BTUs of a certain region for the years 1986 to 2015. Complete parts a and b. Year    Fossil Fuels Production    Fossil Fuels Consumption    Total Energy Consumption1949    28.748    29.002    31.9821950    32.563    31.632    34.6161951    35.792    34.008    36.9741952    34.977    33.800    36.7481953    35.349    34.826    37.6641954    33.764    33.877    36.6391955    37.364    37.410    40.2081956    39.771    38.888    41.7541957    40.133    38.926    41.7871958    37.216    38.717    41.6451959    39.045    40.550    43.4661960    39.869    42.137    45.0861961    40.307    42.758    45.7381962    41.732    44.681    47.8261963    44.037    46.509    49.6441964    45.789    48.543    51.8151965    47.235    50.577    54.0151966    50.035    53.514    57.0141967    52.597    55.127    58.9051968    54.306    58.502    62.4151969    56.286…

Chapter 4 Solutions

Elementary Statistics 2nd Edition

Ch. 4.1 - In Exercises 17-20, compute the correlation...Ch. 4.1 - In Exercises 17-20, compute the correlation...Ch. 4.1 - In Exercises 21-24, determine whether the...Ch. 4.1 - In Exercises 21-24, determine whether the...Ch. 4.1 - In Exercises 21-24, determine whether the...Ch. 4.1 - In Exercises 21-24, determine whether the...Ch. 4.1 - In Exercises 25-30, determine whether the...Ch. 4.1 - In Exercises 25-30, determine whether the...Ch. 4.1 - In Exercises 25-30, determine whether the...Ch. 4.1 - In Exercises 25-30, determine whether the...Ch. 4.1 - In Exercises 25-30, determine whether the...Ch. 4.1 - In Exercises 25-30, determine whether the...Ch. 4.1 - Price of eggs and milk: The following table...Ch. 4.1 - Government funding: The following table presents...Ch. 4.1 - Pass the ball: The NFL Scouting Combine is an...Ch. 4.1 - Carbon footprint: Carbon dioxide (co2) is produced...Ch. 4.1 - Prob. 35ECh. 4.1 - Prob. 36ECh. 4.1 - Blood pressure: A blood pressure measurement...Ch. 4.1 - Prob. 38ECh. 4.1 - Police and crime: In a survey of cities in the...Ch. 4.1 - Age and education: A survey of U.S. adults showed...Ch. 4.1 - Whats the correlation? In a sample of adults, the...Ch. 4.1 - Prob. 42ECh. 4.1 - Changing means and standard deviations: A small...Ch. 4.2 - In Exercises 5-7, fill in each blank with the...Ch. 4.2 - In Exercises 5-7, fill in each blank with the...Ch. 4.2 - In Exercises 5-7, fill in each blank with the...Ch. 4.2 - Prob. 8ECh. 4.2 - Prob. 9ECh. 4.2 - Prob. 10ECh. 4.2 - Prob. 11ECh. 4.2 - Prob. 12ECh. 4.2 - In Exercises 13-16, compute the least-squares...Ch. 4.2 - In Exercises 13-16, compute the least-squares...Ch. 4.2 - In Exercises 13-16, compute the least-squares...Ch. 4.2 - In Exercises 13-16, compute the least-squares...Ch. 4.2 - Compute the least-squares regression he for...Ch. 4.2 - Compute the least-squares regression he for...Ch. 4.2 - In a hypothetical study of the relationship...Ch. 4.2 - Assume in a study of educational level in years...Ch. 4.2 - Prices of egg and milk: The following table...Ch. 4.2 - Prob. 22ECh. 4.2 - Pass the ball: The NFL Scouting Combine is an...Ch. 4.2 - Carbon footprint: Carbon dioxide (CO2) is produced...Ch. 4.2 - Foot temperatures: Foot ulcers are a common...Ch. 4.2 - Mortgage payments: The following table presents...Ch. 4.2 - Blood pressure: A blood pressure measurement...Ch. 4.2 - Butterfly wings: Do larger butterflies live...Ch. 4.2 - Interpreting technology: The following display...Ch. 4.2 - Interpreting technology: The following display...Ch. 4.2 - Interpreting technology: The following MINITAB...Ch. 4.2 - Interpreting technology: The following MINITAB...Ch. 4.2 - Prob. 33ECh. 4.2 - Prob. 34ECh. 4.2 - Least-squares regression line for z-scores: The...Ch. 4.3 - In Exercises 5-10, fill in each blank with the...Ch. 4.3 - In Exercises 5-10, fill in each blank with the...Ch. 4.3 - In Exercises 5-10, fill in each blank with the...Ch. 4.3 - In Exercises 5-10, fill in each blank with the...Ch. 4.3 - In Exercises 5-10, fill in each blank with the...Ch. 4.3 - Prob. 10ECh. 4.3 - Prob. 11ECh. 4.3 - In Exercises 11-14, determine whether the...Ch. 4.3 - Prob. 13ECh. 4.3 - In Exercises 11-14, determine whether the...Ch. 4.3 - For the following data set: Compute the...Ch. 4.3 - For the following data set: Compute the...Ch. 4.3 - For the following data set: Compute the...Ch. 4.3 - For the following data set: Compute the...Ch. 4.3 - Prob. 19ECh. 4.3 - Prob. 20ECh. 4.3 - Prob. 21ECh. 4.3 - Prob. 22ECh. 4.3 - Prob. 23ECh. 4.3 - Prob. 24ECh. 4.3 - Mutant genes: In a study to determine whether the...Ch. 4.3 - Imports and exports: The following table presents...Ch. 4.3 - Energy consumption: The following table presents...Ch. 4.3 - Cost of health care: The following table presents...Ch. 4.3 - Prob. 29ECh. 4.3 - Broadway: The following table presents the average...Ch. 4.3 - Prob. 31ECh. 4.3 - Transforming a variable: The following table...Ch. 4.3 - Prob. 33ECh. 4.3 - Prob. 34ECh. 4 - Compute the correlation coefficient for the...Ch. 4 - The number of theaters showing the movie Monsters...Ch. 4 - Use the data in Exercise 2 to compute the...Ch. 4 - A scatterplot has a correlation of r=1. Describe...Ch. 4 - Prob. 5CQCh. 4 - The following table presents the average delay in...Ch. 4 - Use the least-squares regression line computed in...Ch. 4 - Use the least-squares regression line computed in...Ch. 4 - Prob. 9CQCh. 4 - A scatterplot has a least-squares regression line...Ch. 4 - Prob. 11CQCh. 4 - Prob. 12CQCh. 4 - A sample of students was studied to determine the...Ch. 4 - In a scatter-plot; the point (-2, 7) is...Ch. 4 - The correlation coefficient for a data set is...Ch. 4 - Prob. 1RECh. 4 - Prob. 2RECh. 4 - Hows your mileage? Weight (in tons) and fuel...Ch. 4 - Prob. 4RECh. 4 - Energy efficiency: A sample of 10 households was...Ch. 4 - Energy efficiency: Using the data in Exercise 5:...Ch. 4 - Prob. 7RECh. 4 - Prob. 8RECh. 4 - Prob. 9RECh. 4 - Prob. 10RECh. 4 - Baby weights: The average gestational age (time...Ch. 4 - Commute times: Every morning, Tania leaves for...Ch. 4 - Prob. 13RECh. 4 - Prob. 14RECh. 4 - Prob. 15RECh. 4 - Describe an example which two variables are...Ch. 4 - Two variables x and y have a positive association...Ch. 4 - Prob. 3WAICh. 4 - Prob. 4WAICh. 4 - Prob. 5WAICh. 4 - Prob. 6WAICh. 4 - Prob. 7WAICh. 4 - Prob. 8WAICh. 4 - Prob. 9WAICh. 4 - The following table, Reproduce from chapter...Ch. 4 - The following table, Reproduce from chapter...Ch. 4 - The following table. Reproduce from chapter...Ch. 4 - Prob. 4CSCh. 4 - Prob. 5CSCh. 4 - The relationship between inflation and...Ch. 4 - The relationship between inflation and...Ch. 4 - Relationship between inflation and unemployment is...Ch. 4 - Relationship between inflation and unemployment is...Ch. 4 - If we are going to use data from this year to...Ch. 4 - If we are going to use data from this year to...Ch. 4 - Prob. 12CSCh. 4 - Prob. 13CSCh. 4 - Prob. 14CSCh. 4 - Prob. 15CS
Knowledge Booster
Background pattern image
Statistics
Learn more about
Need a deep-dive on the concept behind this application? Look no further. Learn more about this topic, statistics and related others by exploring similar questions and additional content below.
Similar questions
SEE MORE QUESTIONS
Recommended textbooks for you
Text book image
College Algebra
Algebra
ISBN:9781938168383
Author:Jay Abramson
Publisher:OpenStax
Text book image
Linear Algebra: A Modern Introduction
Algebra
ISBN:9781285463247
Author:David Poole
Publisher:Cengage Learning
Text book image
College Algebra
Algebra
ISBN:9781305115545
Author:James Stewart, Lothar Redlin, Saleem Watson
Publisher:Cengage Learning
Text book image
Algebra and Trigonometry (MindTap Course List)
Algebra
ISBN:9781305071742
Author:James Stewart, Lothar Redlin, Saleem Watson
Publisher:Cengage Learning
Text book image
Algebra & Trigonometry with Analytic Geometry
Algebra
ISBN:9781133382119
Author:Swokowski
Publisher:Cengage
Text book image
College Algebra (MindTap Course List)
Algebra
ISBN:9781305652231
Author:R. David Gustafson, Jeff Hughes
Publisher:Cengage Learning
Correlation Vs Regression: Difference Between them with definition & Comparison Chart; Author: Key Differences;https://www.youtube.com/watch?v=Ou2QGSJVd0U;License: Standard YouTube License, CC-BY
Correlation and Regression: Concepts with Illustrative examples; Author: LEARN & APPLY : Lean and Six Sigma;https://www.youtube.com/watch?v=xTpHD5WLuoA;License: Standard YouTube License, CC-BY