
Videos
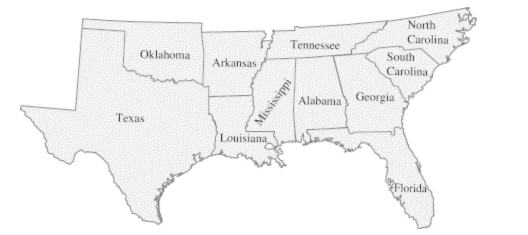
Represent the maps given in Exercises 37-40 by graphs as we did in Example 6. Recall that we join two vertices by an edge if and only if the states that they represent share a stretch of common border
Example 6 Solving the Four-Color Problem for South America
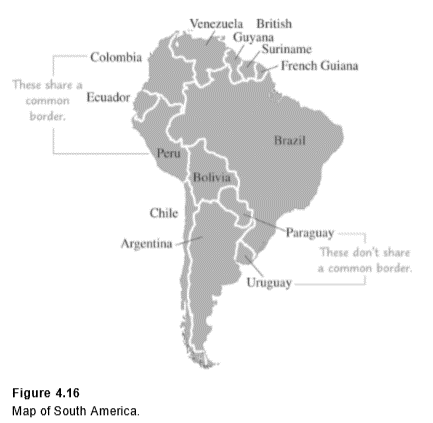
Model the map of South America by a graph and use this graph to color the map using at most four colors.
Solution: In this problem, we have a set of countries, some of which are related in that they share a common border. Therefore, we can model this situation by a graph.
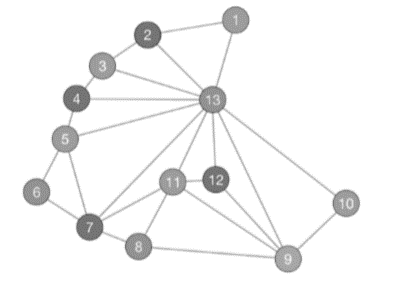
We will represent each country by a vertex; if two countries share a common border, we draw an edge between the corresponding vertices. This graph appears in Figure 4.17 .
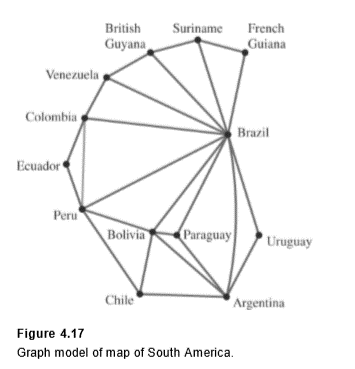
Note that we connect the vertices representing Peru and Colombia with an edge because they share a common boundary. We do not connect the vertices representing Argentina and Peru, because they have no boundary in common.
We can rephrase the map-coloring question now as follows: Using four or fewer colors, can we color the vertices of a graph so that no two vertices of the same edge receive the same color? It is easier to think about coloring a graph than it is to think about coloring the original map.
We show one coloring using four colors in Figure 4.18 and another coloring that I generated on my iPad using a graph theory app called Graphynx. Notice that Graphynx again had to use four colors to color the graph.
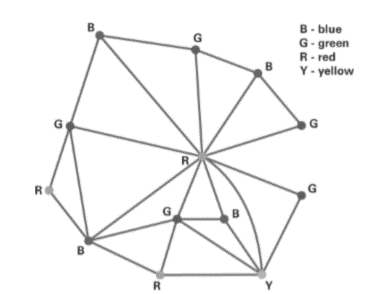
Figure 4.18 Coloring of graph of South America.
Graphynx coloring of graph of South America.
Want to see the full answer?
Check out a sample textbook solution
Chapter 4 Solutions
Mathematics All Around-Workbook


- Find the equation of the line / in the figure below. Give exact values using the form y = mx + b. m = b = y WebAssign Plot f(x) = 10* log 9 Xarrow_forwarda. Find the general flow pattern of the network shown in the figure. b. Assuming that the flow must be in the directions indicated, find the minimum flows in the branches denoted by X2, X3, X4, and x5 a. Choose the correct answer below and fill in the answer boxes to complete your choice. OA. x₁ = X2 is free X3 is free B. X₁ is free x2= ×4 is free X5 is free X6 = X3= X4 X5 X6 = 11 = ○ C. D. X2 is free X3= X4 is free X5 is free x2 = 0 X3 is free ×4 = X6 is free gave 20 30 12 C 804 60-> B <<90 314 X4D -80 E T 20 40 xarrow_forward1 - Multiple Regression Equations and Predictions with XLMiner Analysis ToolPak (Structured) Video The owner of Showtime Movie Theaters, Inc., would like to predict weekly gross revenue as a function of advertising expenditures. Historical data for a sample of eight weeks are entered into the Microsoft Excel Online file below. Use the XLMiner Analysis ToolPak to perform your regression analysis in the designated areas of the spreadsheet. Due to a recent change by Microsoft you will need to open the XLMiner Analysis ToolPak add-in manually from the home ribbon. Screenshot of ToolPak X Open spreadsheet a. Develop an estimated regression equation with the amount of television advertising as the independent variable (to 2 decimals). JAN 27 Revenue = × TVAdv + b. Develop an estimated regression equation with both television advertising and newspaper advertising as the independent variables (to 2 decimals). Revenue = + TVAdy + NewsAdv c. Is the estimated regression equation coefficient for…arrow_forward
- A rug company weaves rugs that are made by repeating the design in Figure 12.49. Lengths of portions of the design are indicated in the figure. The yarn for the shaded portion of the design costs $5 per square unit, and the yarn for the unshaded portion of the design costs $3 per square unit. How much will the yarn for a 60-unit-by-84-unit rug cost? Explain your reasoning.arrow_forwardConsider an economy with three sectors, Chemicals & Metals, Fuels & Power, and Machinery. Chemicals sells 30% of its output to Fuels and 60% to Machinery and retains the rest. Fuels sells 70% of its output to Chemicals and 20% to Machinery and retains the rest. Machinery sells 40% of its output to Chemicals and 30% to Fuels and retains the rest. Complete parts (a) through (c) below a. Construct the exchange table for this economy. Distribution of Output from: Chemicals Fuels Machinery (Type integers or decimals.) Purchased by: Chemicals Fuels Machineryarrow_forwardA particle travels along a straight line path given by s=9.5t3-2.2t2-4.5t+9.9 (in meters). What time does it change direction? Report the higher of the answers to the nearest 2 decimal places in seconds.arrow_forward
- 11:18 91 chisholminstitute.bksblive2.com.au 1.5 ACSF L5 SC Geometry and Measure: Pythagorus' Theorum Pythagorean Problems Calculate the lengths of all of this triangle's sides. x = 64 cm² y A ↑ ४ 225 cm² + ? Image not drawn accurately. 45 45arrow_forwardWhat is WX explain your reasoningarrow_forwardUse the method of disks to find the volume of the solid that is obtained when the region under the curve y = over the interval [4,17] is rotated about the x-axis.arrow_forward
- search P(QP) Q 1.-P:PR 2.-QP:PR 3. Q:MT 1, 2 4. Q:DNE 3 Submit 4.5 P. (QP) Q 1. P: PR 2. Q-P PR 3. -Q:AS 4. -P:MP 2, 3 5. Submit 17 A Previous Chapter Next Chapterarrow_forward1. Find the area of the region enclosed between the curves y = x and y = x. Sketch the region.arrow_forwardfor the given rectangular coordinates, find two sets of polar coordinates for which 0≤θ<2π, one with r>0 and the other with r<0. (-2sqrt(3),9)arrow_forward
 Discrete Mathematics and Its Applications ( 8th I...MathISBN:9781259676512Author:Kenneth H RosenPublisher:McGraw-Hill Education
 Mathematics for Elementary Teachers with Activiti...MathISBN:9780134392790Author:Beckmann, SybillaPublisher:PEARSON
 Thinking Mathematically (7th Edition)MathISBN:9780134683713Author:Robert F. BlitzerPublisher:PEARSON
 Discrete Mathematics With ApplicationsMathISBN:9781337694193Author:EPP, Susanna S.Publisher:Cengage Learning,
 Pathways To Math Literacy (looseleaf)MathISBN:9781259985607Author:David Sobecki Professor, Brian A. MercerPublisher:McGraw-Hill Education