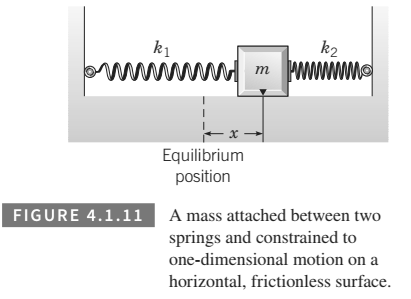
Concept explainers
A body of mass

Want to see the full answer?
Check out a sample textbook solution
Chapter 4 Solutions
DIFFERENTIAL EQUATIONS-NEXTGEN WILEYPLUS
Additional Math Textbook Solutions
Algebra and Trigonometry (6th Edition)
Elementary Statistics
University Calculus: Early Transcendentals (4th Edition)
Calculus: Early Transcendentals (2nd Edition)
Elementary Statistics: Picturing the World (7th Edition)
- could you please show the computation of this by wiresarrow_forward0 n AM RIES s of of 10 m Frequency 40 Frequency 20 20 30 10 You make two histograms from two different data sets (see the following figures), each one containing 200 observations. Which of the histograms has a smaller spread: the first or the second? 40 30 20 10 0 20 40 60 0 20 20 40 60 60 80 80 100 80 100arrow_forward4 Consider f(x) periodic function with period 2, coinciding with (x) = -x on the interval [,0) and being the null function on the interval [0,7). The Fourier series of f: (A) does not converge in quadratic norm to f(x) on [−π,π] (B) is pointwise convergent to f(x) for every x = R П (C) is in the form - 4 ∞ +Σ ak cos(kx) + bk sin(kx), ak ‡0, bk ‡0 k=1 (D) is in the form ak cos(kx) + bk sin(kx), ak 0, bk 0 k=1arrow_forward
- TIP the aren't, the data are not sym 11 Suppose that the average salary at a certain company is $100,000, and the median salary is $40,000. a. What do these figures tell you about the shape of the histogram of salaries at this company? b. Which measure of center is more appro- priate here? c. Suppose that the company goes through a salary negotiation. How can people on each side use these summary statistics to their advantage? 6360 be 52 PART 1 Getting Off to a Statistically Significant Sarrow_forwardSolve the equation.arrow_forward12 Suppose that you know that a data set is skewed left, and you know that the two measures of center are 19 and 38. Which figure is the mean and which is the median?arrow_forward
- could you explain this pleasearrow_forwardthe answer is C, could you show me how to do itarrow_forwardy of 45 home- televisions u find that 010020 le own one, ee, and 1 owns y histogram of 4 Suppose that you have a loaded die. You roll it several times and record the outcomes, which are shown in the following figure. Histogram for Loaded Die 444% 34.00 48% 6% 2% Frequency 20 20 15 155 10 5- ம 0 1 2 3 4 Outcome 5 6 a. Make a relative frequency histogram of these results. b. You can make a relative frequency histo- gram from a frequency histogram; can you go the other direction?arrow_forward
- 7. [-/1 Points] DETAILS MY NOTES SESSCALCET2 6.1.505.XP. Evaluate the integral. (Use C for the constant of integration.) 21z³e² dz | 21 Need Help? Read It SUBMIT ANSWER 8. [-/1 Points] DETAILS MY NOTES SESSCALCET2 6.1.020. Evaluate the integral. 36 In y dy ₤36 25 Need Help? Read It SUBMIT ANSWER 9. [-/1 Points] DETAILS MY NOTES SESSCALCET2 6.1.009. Evaluate the integral. (Use C for the constant of integration.) In(7x In(7x + 1) dxarrow_forward10. [-/1 Points] DETAILS MY NOTES SESSCALCET2 6.1.506.XP. Evaluate the integral. √xy dy Need Help? Read It Watch It SUBMIT ANSWER 11. [-/1 Points] DETAILS MY NOTES SESSCALCET2 6.1.023. Evaluate the integral. 1/2 7 cos-1 x dx Need Help? Read It Watch It SUBMIT ANSWER 12. [-/1 Points] DETAILS MY NOTES SESSCALCET2 6.1.507.XP. Evaluate the integral. L² 0 (In x)² x3 dx Need Help? Read Itarrow_forwardCalculate the mean for Study Hours and Test Scores. Compute the covariance between the two variables using the formula: Calculate the standard deviation for Study Hours (X) and Test Scores (Y). Determine the correlation coefficient Interpret the results: What does the calculated r-value indicate about the relationship between study hours and test scores?arrow_forward
 Linear Algebra: A Modern IntroductionAlgebraISBN:9781285463247Author:David PoolePublisher:Cengage Learning
