
Videos
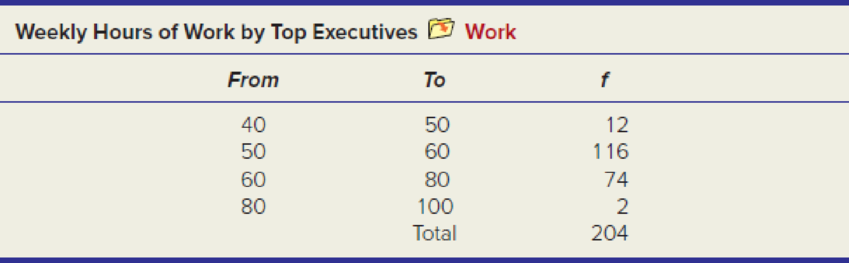
The self-reported number of hours worked per week by 204 top executives is given below. (a) Estimate the mean, standard deviation, and coefficient of variation using an Excel worksheet to organize your calculations. (b) Do the unequal class sizes hamper your calculations? Why do you suppose that was done?
a.
Estimate the mean, standard deviation and coefficient of variation from the grouped data and frequencies.
Answer to Problem 89CE
The mean, standard deviation and coefficient of variation from the grouped data and frequencies are:
| Measures | Values |
| Mean | 60.196 |
| Standard deviation | 8.536 |
| Coefficient of variation | 14.2% |
Explanation of Solution
Calculation:
The given information is about the distribution of number of hours worked per week by 204 top executives.
The mean for the grouped data is:
The standard deviation for the grouped data is:
Where,
n is the total sample size
If
Coefficient of variation:
The coefficient of variation (CV) is a measure of relative variability which is the ratio of the standard deviation to the mean. If the coefficient of variation is high, then level of dispersion around the mean is high. The CV is often expressed as a percentage.
Where, s be the sample standard deviation and
The table below gives the mean for the grouped data:
|
From |
To |
Frequency |
Mid-point | |||
| 40 | 50 | 12 | 540 | 2771.04 | ||
| 50 | 60 | 116 | 6,380 | 3131.768 | ||
| 60 | 80 | 74 | 5,180 | 7112.88 | ||
| 80 | 100 | 2 | 180 | 1776.56 | ||
The mean for the grouped data is:
Substitute the values
Thus, the mean from the grouped data and frequencies is 60.196.
The standard deviation for the grouped data is:
Substitute the values
Thus, the standard deviation from the grouped data and frequencies is 8.536.
The coefficient of variation is:
Substitute
Thus, the CV is 14.18%.
b.
State whether the unequal class size hamper the calculations.
Answer to Problem 89CE
No, the unequal class sizes hamper the calculations.
Explanation of Solution
The unequal sample sizes in the observations disturb the calculations. The unequal class sizes means that none of the class size will hold the value zero.
Want to see more full solutions like this?
Chapter 4 Solutions
Applied Statistics in Business and Economics


- Let X be a continuous RV with PDF where a > 0 and 0 > 0 are parameters. verify that f-∞ /x (x)dx = 1. Find the CDF, Fx (7), of X.arrow_forward6. [20] Let X be a continuous RV with PDF 2(1), 1≤x≤2 fx(x) = 0, otherwisearrow_forwardA survey of 581 citizens found that 313 of them favor a new bill introduced by the city. We want to find a 95% confidence interval for the true proportion of the population who favor the bill. What is the lower limit of the interval? Enter the result as a decimal rounded to 3 decimal digits. Your Answer:arrow_forward
- A survey of 581 citizens found that 313 of them favor a new bill introduced by the city. We want to find a 95% confidence interval for the true proportion of the population who favor the bill. What is the lower limit of the interval? Enter the result as a decimal rounded to 3 decimal digits. Your Answer:arrow_forward2. The SMSA data consisting of 141 observations on 10 variables is fitted by the model below: 1 y = Bo+B1x4 + ẞ2x6 + ẞ3x8 + √1X4X8 + V2X6X8 + €. See Question 2, Tutorial 3 for the meaning of the variables in the above model. The following results are obtained: Estimate Std. Error t value Pr(>|t|) (Intercept) 1.302e+03 4.320e+02 3.015 0.00307 x4 x6 x8 x4:x8 x6:x8 -1.442e+02 2.056e+01 -7.013 1.02e-10 6.340e-01 6.099e+00 0.104 0.91737 -9.455e-02 5.802e-02 -1.630 0.10550 2.882e-02 2.589e-03 11.132 1.673e-03 7.215e-04 2.319 F) x4 1 3486722 3486722 17.9286 4.214e-05 x6 1 14595537 x8 x4:x8 x6:x8 1 132.4836 < 2.2e-16 1045693 194478 5.3769 0.02191 1 1198603043 1198603043 6163.1900 < 2.2e-16 1 25765100 25765100 1045693 Residuals 135 26254490 Estimated variance matrix (Intercept) x4 x6 x8 x4:x8 x6:x8 (Intercept) x4 x6 x8 x4:x8 x6:x8 0.18875694 1.866030e+05 -5.931735e+03 -2.322825e+03 -16.25142055 0.57188953 -5.931735e+03 4.228816e+02 3.160915e+01 0.61621781 -0.03608028 -0.00445013 -2.322825e+03…arrow_forwardIn some applications the distribution of a discrete RV, X resembles the Poisson distribution except that 0 is not a possible value of X. Consider such a RV with PMF where 1 > 0 is a parameter, and c is a constant. (a) Find the expression of c in terms of 1. (b) Find E(X). (Hint: You can use the fact that, if Y ~ Poisson(1), the E(Y) = 1.)arrow_forward
- Suppose that X ~Bin(n,p). Show that E[(1 - p)] = (1-p²)".arrow_forwardI need help with this problem and an explanation of the solution for the image described below. (Statistics: Engineering Probabilities)arrow_forwardI need help with this problem and an explanation of the solution for the image described below. (Statistics: Engineering Probabilities)arrow_forward
- This exercise is based on the following data on four bodybuilding supplements. (Figures shown correspond to a single serving.) Creatine(grams) L-Glutamine(grams) BCAAs(grams) Cost($) Xtend(SciVation) 0 2.5 7 1.00 Gainz(MP Hardcore) 2 3 6 1.10 Strongevity(Bill Phillips) 2.5 1 0 1.20 Muscle Physique(EAS) 2 2 0 1.00 Your personal trainer suggests that you supplement with at least 10 grams of creatine, 39 grams of L-glutamine, and 90 grams of BCAAs each week. You are thinking of combining Xtend and Gainz to provide you with the required nutrients. How many servings of each should you combine to obtain a week's supply that meets your trainer's specifications at the least cost? (If an answer does not exist, enter DNE.) servings of xtend servings of gainzarrow_forwardI need help with this problem and an explanation of the solution for the image described below. (Statistics: Engineering Probabilities)arrow_forwardI need help with this problem and an explanation of the solution for the image described below. (Statistics: Engineering Probabilities)arrow_forward
 Glencoe Algebra 1, Student Edition, 9780079039897...AlgebraISBN:9780079039897Author:CarterPublisher:McGraw Hill
 Big Ideas Math A Bridge To Success Algebra 1: Stu...AlgebraISBN:9781680331141Author:HOUGHTON MIFFLIN HARCOURTPublisher:Houghton Mifflin Harcourt
 Holt Mcdougal Larson Pre-algebra: Student Edition...AlgebraISBN:9780547587776Author:HOLT MCDOUGALPublisher:HOLT MCDOUGAL