
Intro Stats
4th Edition
ISBN: 9780321825278
Author: Richard D. De Veaux, Paul F. Velleman, David E. Bock
Publisher: PEARSON
expand_more
expand_more
format_list_bulleted
Videos
Textbook Question
Chapter 4, Problem 49E
Assets again Here are the same data you saw in Exercise 45 after re-expressions as the square root of assets (in $M) and the logarithm of assets (in $M):
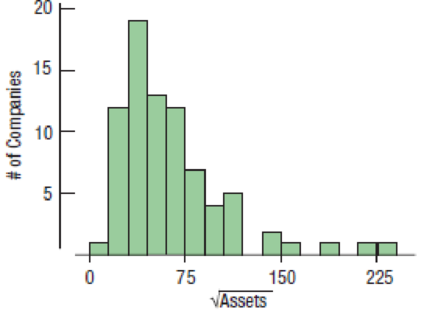
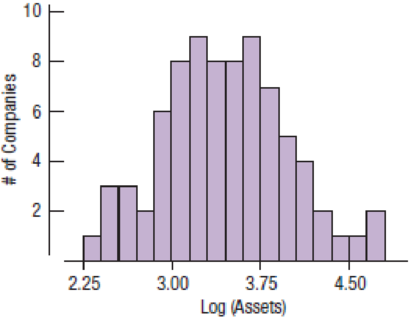
- a) Which re-expression do you prefer? Why?
- b) In the square root re-expression, what does the value 50 actually indicate about the company’s assets?
- c) In the logarithm re-expression, what does the value 3 actually indicate about the company’s assets?
Expert Solution & Answer
Want to see the full answer?
Check out a sample textbook solution
Students have asked these similar questions
In a company with 80 employees, 60 earn $10.00 per hour and 20 earn $13.00 per
hour.
Is this average hourly wage considered representative?
The following is a list of questions answered correctly on an exam. Calculate the
Measures of Central Tendency from the ungrouped data list.
NUMBER OF QUESTIONS ANSWERED CORRECTLY ON AN APTITUDE EXAM
112
72
69
97
107
73
92
76
86
73
126
128
118
127
124
82
104
132
134
83
92
108
96
100
92
115
76
91
102
81
95
141
81
80
106
84
119
113
98
75
68
98
115
106
95
100
85
94
106
119
The following ordered data list shows the data speeds for cell phones used by a
telephone company at an airport:
A. Calculate the Measures of Central Tendency using the table in point B.
B. Are there differences in the measurements obtained in A and C? Why (give at
least one justified reason)?
0.8
1.4
1.8
1.9
3.2
3.6
4.5
4.5
4.6
6.2
6.5
7.7
7.9
9.9
10.2
10.3
10.9
11.1
11.1
11.6
11.8
12.0
13.1
13.5
13.7
14.1
14.2
14.7
15.0
15.1
15.5
15.8
16.0
17.5
18.2
20.2
21.1
21.5
22.2
22.4
23.1
24.5
25.7
28.5
34.6
38.5
43.0
55.6
71.3
77.8
Chapter 4 Solutions
Intro Stats
Ch. 4.2 - The Bureau of Transportation Statistics of the...Ch. 4.2 - The Bureau of Transportation Statistics of the...Ch. 4.2 - Prob. 3JCCh. 4 - Prob. 1ECh. 4 - Prob. 2ECh. 4 - Prob. 3ECh. 4 - 4. Load factors by year Here is a display of the...Ch. 4 - Prob. 5ECh. 4 - Prob. 6ECh. 4 - Prob. 7E
Ch. 4 - Prob. 8ECh. 4 - Prob. 9ECh. 4 - Exoplanets re-expressed Here are the exoplanet...Ch. 4 - Prob. 15ECh. 4 - Prob. 16ECh. 4 - Prob. 17ECh. 4 - Prob. 18ECh. 4 - Sugar in cereals Sugar is a major ingredient in...Ch. 4 - Tendon transfers People with spinal cord injuries...Ch. 4 - Prob. 21ECh. 4 - Camp sites Shown below are the histogram and...Ch. 4 - Hospital stays The U.S. National Center for Health...Ch. 4 - Prob. 24ECh. 4 - Womens basketball Here are boxplots of the points...Ch. 4 - Prob. 26ECh. 4 - Marriage age In 1975, did men and women marry at...Ch. 4 - Fuel economy and cylinders Describe what these...Ch. 4 - Prob. 29ECh. 4 - Ozone Ozone levels (in parts per billion, ppb)...Ch. 4 - Test scores Three statistics classes all took the...Ch. 4 - Prob. 32ECh. 4 - Graduation? A survey of major universities asked...Ch. 4 - Vineyards Here are summary statistics for the...Ch. 4 - Caffeine A student study of the effects of...Ch. 4 - SAT scores Here are the summary statistics for...Ch. 4 - Prob. 37ECh. 4 - Framingham cholesterol The Framingham Heart Study...Ch. 4 - Prob. 39ECh. 4 - Cloud seeding In an experiment to determine...Ch. 4 - Industrial experiment Engineers at a computer...Ch. 4 - Cholesterol and smoking A study that examined the...Ch. 4 - Prob. 43ECh. 4 - Prob. 44ECh. 4 - Prob. 45ECh. 4 - Prob. 46ECh. 4 - Assets Here is a histogram of the assets (in...Ch. 4 - Prob. 48ECh. 4 - Assets again Here are the same data you saw in...Ch. 4 - Rainmakers The table lists the amounts of rainfall...Ch. 4 - Stereograms Stereograms appear to be composed...Ch. 4 - Stereograms, revisited Because of the skewness of...
Additional Math Textbook Solutions
Find more solutions based on key concepts
For Exercises 13–18, write the negation of the statement.
13. The cell phone is out of juice.
Math in Our World
1. How much money is Joe earning when he’s 30?
Pathways To Math Literacy (looseleaf)
(a) Make a stem-and-leaf plot for these 24 observations on the number of customers who used a down-town CitiBan...
APPLIED STAT.IN BUS.+ECONOMICS
Provide an example of a qualitative variable and an example of a quantitative variable.
Elementary Statistics ( 3rd International Edition ) Isbn:9781260092561
Knowledge Booster


Learn more about
Need a deep-dive on the concept behind this application? Look no further. Learn more about this topic, statistics and related others by exploring similar questions and additional content below.Similar questions
- In a company with 80 employees, 60 earn $10.00 per hour and 20 earn $13.00 per hour. a) Determine the average hourly wage. b) In part a), is the same answer obtained if the 60 employees have an average wage of $10.00 per hour? Prove your answer.arrow_forwardThe following ordered data list shows the data speeds for cell phones used by a telephone company at an airport: A. Calculate the Measures of Central Tendency from the ungrouped data list. B. Group the data in an appropriate frequency table. 0.8 1.4 1.8 1.9 3.2 3.6 4.5 4.5 4.6 6.2 6.5 7.7 7.9 9.9 10.2 10.3 10.9 11.1 11.1 11.6 11.8 12.0 13.1 13.5 13.7 14.1 14.2 14.7 15.0 15.1 15.5 15.8 16.0 17.5 18.2 20.2 21.1 21.5 22.2 22.4 23.1 24.5 25.7 28.5 34.6 38.5 43.0 55.6 71.3 77.8arrow_forwardBusinessarrow_forward
- https://www.hawkeslearning.com/Statistics/dbs2/datasets.htmlarrow_forwardNC Current Students - North Ce X | NC Canvas Login Links - North ( X Final Exam Comprehensive x Cengage Learning x WASTAT - Final Exam - STAT → C webassign.net/web/Student/Assignment-Responses/submit?dep=36055360&tags=autosave#question3659890_9 Part (b) Draw a scatter plot of the ordered pairs. N Life Expectancy Life Expectancy 80 70 600 50 40 30 20 10 Year of 1950 1970 1990 2010 Birth O Life Expectancy Part (c) 800 70 60 50 40 30 20 10 1950 1970 1990 W ALT 林 $ # 4 R J7 Year of 2010 Birth F6 4+ 80 70 60 50 40 30 20 10 Year of 1950 1970 1990 2010 Birth Life Expectancy Ox 800 70 60 50 40 30 20 10 Year of 1950 1970 1990 2010 Birth hp P.B. KA & 7 80 % 5 H A B F10 711 N M K 744 PRT SC ALT CTRLarrow_forwardHarvard University California Institute of Technology Massachusetts Institute of Technology Stanford University Princeton University University of Cambridge University of Oxford University of California, Berkeley Imperial College London Yale University University of California, Los Angeles University of Chicago Johns Hopkins University Cornell University ETH Zurich University of Michigan University of Toronto Columbia University University of Pennsylvania Carnegie Mellon University University of Hong Kong University College London University of Washington Duke University Northwestern University University of Tokyo Georgia Institute of Technology Pohang University of Science and Technology University of California, Santa Barbara University of British Columbia University of North Carolina at Chapel Hill University of California, San Diego University of Illinois at Urbana-Champaign National University of Singapore McGill…arrow_forward
- Name Harvard University California Institute of Technology Massachusetts Institute of Technology Stanford University Princeton University University of Cambridge University of Oxford University of California, Berkeley Imperial College London Yale University University of California, Los Angeles University of Chicago Johns Hopkins University Cornell University ETH Zurich University of Michigan University of Toronto Columbia University University of Pennsylvania Carnegie Mellon University University of Hong Kong University College London University of Washington Duke University Northwestern University University of Tokyo Georgia Institute of Technology Pohang University of Science and Technology University of California, Santa Barbara University of British Columbia University of North Carolina at Chapel Hill University of California, San Diego University of Illinois at Urbana-Champaign National University of Singapore…arrow_forwardA company found that the daily sales revenue of its flagship product follows a normal distribution with a mean of $4500 and a standard deviation of $450. The company defines a "high-sales day" that is, any day with sales exceeding $4800. please provide a step by step on how to get the answers in excel Q: What percentage of days can the company expect to have "high-sales days" or sales greater than $4800? Q: What is the sales revenue threshold for the bottom 10% of days? (please note that 10% refers to the probability/area under bell curve towards the lower tail of bell curve) Provide answers in the yellow cellsarrow_forwardFind the critical value for a left-tailed test using the F distribution with a 0.025, degrees of freedom in the numerator=12, and degrees of freedom in the denominator = 50. A portion of the table of critical values of the F-distribution is provided. Click the icon to view the partial table of critical values of the F-distribution. What is the critical value? (Round to two decimal places as needed.)arrow_forward
- A retail store manager claims that the average daily sales of the store are $1,500. You aim to test whether the actual average daily sales differ significantly from this claimed value. You can provide your answer by inserting a text box and the answer must include: Null hypothesis, Alternative hypothesis, Show answer (output table/summary table), and Conclusion based on the P value. Showing the calculation is a must. If calculation is missing,so please provide a step by step on the answers Numerical answers in the yellow cellsarrow_forwardShow all workarrow_forwardShow all workarrow_forward
arrow_back_ios
SEE MORE QUESTIONS
arrow_forward_ios
Recommended textbooks for you
 Big Ideas Math A Bridge To Success Algebra 1: Stu...AlgebraISBN:9781680331141Author:HOUGHTON MIFFLIN HARCOURTPublisher:Houghton Mifflin Harcourt
 Algebra & Trigonometry with Analytic GeometryAlgebraISBN:9781133382119Author:SwokowskiPublisher:Cengage
 Glencoe Algebra 1, Student Edition, 9780079039897...AlgebraISBN:9780079039897Author:CarterPublisher:McGraw Hill
 Algebra for College StudentsAlgebraISBN:9781285195780Author:Jerome E. Kaufmann, Karen L. SchwittersPublisher:Cengage Learning
Big Ideas Math A Bridge To Success Algebra 1: Stu...
Algebra
ISBN:9781680331141
Author:HOUGHTON MIFFLIN HARCOURT
Publisher:Houghton Mifflin Harcourt
Algebra & Trigonometry with Analytic Geometry
Algebra
ISBN:9781133382119
Author:Swokowski
Publisher:Cengage
Glencoe Algebra 1, Student Edition, 9780079039897...
Algebra
ISBN:9780079039897
Author:Carter
Publisher:McGraw Hill
Algebra for College Students
Algebra
ISBN:9781285195780
Author:Jerome E. Kaufmann, Karen L. Schwitters
Publisher:Cengage Learning
Implicit Differentiation with Transcendental Functions; Author: Mathispower4u;https://www.youtube.com/watch?v=16WoO59R88w;License: Standard YouTube License, CC-BY
How to determine the difference between an algebraic and transcendental expression; Author: Study Force;https://www.youtube.com/watch?v=xRht10w7ZOE;License: Standard YouTube License, CC-BY