
Intro Stats
4th Edition
ISBN: 9780321825278
Author: Richard D. De Veaux, Paul F. Velleman, David E. Bock
Publisher: PEARSON
expand_more
expand_more
format_list_bulleted
Videos
Textbook Question
Chapter 4, Problem 27E
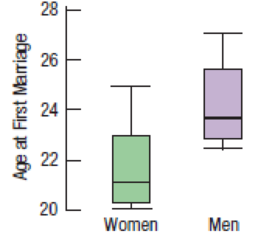
Marriage age In 1975, did men and women marry at the same age? Here are boxplots of the age at first marriage for a sample of U.S. citizens then. Write a brief report discussing what these data show.
Expert Solution & Answer
Want to see the full answer?
Check out a sample textbook solution
Students have asked these similar questions
A retail chain is interested in determining whether a digital video point-of-purchase (POP) display would stimulate higher sales for a brand advertised compared to the standard cardboard point-of-purchase display. To test this, a one-shot static group design experiment was conducted over a four-week period in 100 different stores. Fifty stores were randomly assigned to the control treatment (standard display) and the other 50 stores were randomly assigned to the experimental treatment (digital display). Compare the sales of the control group (standard POP) to the experimental group (digital POP).
What were the average sales for the standard POP display (control group)?
What were the sales for the digital display (experimental group)?
What is the (mean) difference in sales between the experimental group and control group?
List the null hypothesis being tested.
Do you reject or retain the null hypothesis based on the results of the independent t-test?
Was the difference between the…
Question 4
An article in Quality Progress (May 2011, pp. 42-48) describes the use of factorial experiments to improve a
silver powder production process. This product is used in conductive pastes to manufacture a wide variety of
products ranging from silicon wafers to elastic membrane switches. Powder density (g/cm²) and surface area
(cm/g) are the two critical characteristics of this product. The experiments involved three factors: reaction
temperature, ammonium percentage, stirring rate. Each of these factors had two levels, and the design was
replicated twice. The design is shown in Table 3.
A222222222222233
Stir Rate
(RPM)
Ammonium
(%)
Table 3: Silver Powder Experiment from Exercise 13.23
Temperature
(°C)
Density
Surface Area
100
8
14.68
0.40
100
8
15.18
0.43
30
100
8
15.12
0.42
30
100
17.48
0.41
150
7.54
0.69
150
8
6.66
0.67
30
150
8
12.46
0.52
30
150
8
12.62
0.36
100
40
10.95
0.58
100
40
17.68
0.43
30
100
40
12.65
0.57
30
100
40
15.96
0.54
150
40
8.03
0.68
150
40
8.84
0.75
30
150…
-
+
++
Table 2: Crack Experiment for Exercise 2
A B C D Treatment Combination
(1)
Replicate
I II
7.037
6.376
14.707 15.219
|++++ 1
བྱ॰༤༠སྦྱོ སྦྱོཋཏྟཱུ
a
b
ab
11.635 12.089
17.273 17.815
с
ас
10.403 10.151
4.368 4.098
bc
abc
9.360 9.253
13.440 12.923
d
8.561 8.951
ad
16.867 17.052
bd
13.876 13.658
abd
19.824 19.639
cd
11.846 12.337
acd
6.125
5.904
bcd
11.190 10.935
abcd
15.653 15.053
Question 3
Continuation of Exercise 2. One of the variables in the experiment described in Exercise 2, heat treatment
method (C), is a categorical variable. Assume that the remaining factors are continuous.
(a) Write two regression models for predicting crack length, one for each level of the heat treatment method
variable. What differences, if any, do you notice in these two equations?
(b) Generate appropriate response surface contour plots for the two regression models in part (a).
(c) What set of conditions would you recommend for the factors A, B, and D if you use heat treatment method
C = +?
(d) Repeat…
Chapter 4 Solutions
Intro Stats
Ch. 4.2 - The Bureau of Transportation Statistics of the...Ch. 4.2 - The Bureau of Transportation Statistics of the...Ch. 4.2 - Prob. 3JCCh. 4 - Prob. 1ECh. 4 - Prob. 2ECh. 4 - Prob. 3ECh. 4 - 4. Load factors by year Here is a display of the...Ch. 4 - Prob. 5ECh. 4 - Prob. 6ECh. 4 - Prob. 7E
Ch. 4 - Prob. 8ECh. 4 - Prob. 9ECh. 4 - Exoplanets re-expressed Here are the exoplanet...Ch. 4 - Prob. 15ECh. 4 - Prob. 16ECh. 4 - Prob. 17ECh. 4 - Prob. 18ECh. 4 - Sugar in cereals Sugar is a major ingredient in...Ch. 4 - Tendon transfers People with spinal cord injuries...Ch. 4 - Prob. 21ECh. 4 - Camp sites Shown below are the histogram and...Ch. 4 - Hospital stays The U.S. National Center for Health...Ch. 4 - Prob. 24ECh. 4 - Womens basketball Here are boxplots of the points...Ch. 4 - Prob. 26ECh. 4 - Marriage age In 1975, did men and women marry at...Ch. 4 - Fuel economy and cylinders Describe what these...Ch. 4 - Prob. 29ECh. 4 - Ozone Ozone levels (in parts per billion, ppb)...Ch. 4 - Test scores Three statistics classes all took the...Ch. 4 - Prob. 32ECh. 4 - Graduation? A survey of major universities asked...Ch. 4 - Vineyards Here are summary statistics for the...Ch. 4 - Caffeine A student study of the effects of...Ch. 4 - SAT scores Here are the summary statistics for...Ch. 4 - Prob. 37ECh. 4 - Framingham cholesterol The Framingham Heart Study...Ch. 4 - Prob. 39ECh. 4 - Cloud seeding In an experiment to determine...Ch. 4 - Industrial experiment Engineers at a computer...Ch. 4 - Cholesterol and smoking A study that examined the...Ch. 4 - Prob. 43ECh. 4 - Prob. 44ECh. 4 - Prob. 45ECh. 4 - Prob. 46ECh. 4 - Assets Here is a histogram of the assets (in...Ch. 4 - Prob. 48ECh. 4 - Assets again Here are the same data you saw in...Ch. 4 - Rainmakers The table lists the amounts of rainfall...Ch. 4 - Stereograms Stereograms appear to be composed...Ch. 4 - Stereograms, revisited Because of the skewness of...
Additional Math Textbook Solutions
Find more solutions based on key concepts
(a) Make a stem-and-leaf plot for these 24 observations on the number of customers who used a down-town CitiBan...
APPLIED STAT.IN BUS.+ECONOMICS
Use the ideas in drawings a and b to find the solution to Gausss Problem for the sum 1+2+3+...+n. Explain your ...
A Problem Solving Approach To Mathematics For Elementary School Teachers (13th Edition)
1. How is a sample related to a population?
Elementary Statistics: Picturing the World (7th Edition)
The largest polynomial that divides evenly into a list of polynomials is called the _______.
Elementary & Intermediate Algebra
First Derivative Test a. Locale the critical points of f. b. Use the First Derivative Test to locale the local ...
Calculus: Early Transcendentals (2nd Edition)
Knowledge Booster


Learn more about
Need a deep-dive on the concept behind this application? Look no further. Learn more about this topic, statistics and related others by exploring similar questions and additional content below.Similar questions
- Question 2 A nickel-titanium alloy is used to make components for jet turbine aircraft engines. Cracking is a potentially serious problem in the final part because it can lead to nonrecoverable failure. A test is run at the parts producer to determine the effect of four factors on cracks. The four factors are: pouring temperature (A), titanium content (B), heat treatment method (C), amount of grain refiner used (D). Two replicates of a 24 design are run, and the length of crack (in mm x10-2) induced in a sample coupon subjected to a standard test is measured. The data are shown in Table 2. 1 (a) Estimate the factor effects. Which factor effects appear to be large? (b) Conduct an analysis of variance. Do any of the factors affect cracking? Use a = 0.05. (c) Write down a regression model that can be used to predict crack length as a function of the significant main effects and interactions you have identified in part (b). (d) Analyze the residuals from this experiment. (e) Is there an…arrow_forwardA 24-1 design has been used to investigate the effect of four factors on the resistivity of a silicon wafer. The data from this experiment are shown in Table 4. Table 4: Resistivity Experiment for Exercise 5 Run A B с D Resistivity 1 23 2 3 4 5 6 7 8 9 10 11 12 I+I+I+I+Oooo 0 0 ||++TI++o000 33.2 4.6 31.2 9.6 40.6 162.4 39.4 158.6 63.4 62.6 58.7 0 0 60.9 3 (a) Estimate the factor effects. Plot the effect estimates on a normal probability scale. (b) Identify a tentative model for this process. Fit the model and test for curvature. (c) Plot the residuals from the model in part (b) versus the predicted resistivity. Is there any indication on this plot of model inadequacy? (d) Construct a normal probability plot of the residuals. Is there any reason to doubt the validity of the normality assumption?arrow_forwardStem1: 1,4 Stem 2: 2,4,8 Stem3: 2,4 Stem4: 0,1,6,8 Stem5: 0,1,2,3,9 Stem 6: 2,2 What’s the Min,Q1, Med,Q3,Max?arrow_forward
- Are the t-statistics here greater than 1.96? What do you conclude? colgPA= 1.39+0.412 hsGPA (.33) (0.094) Find the P valuearrow_forwardA poll before the elections showed that in a given sample 79% of people vote for candidate C. How many people should be interviewed so that the pollsters can be 99% sure that from 75% to 83% of the population will vote for candidate C? Round your answer to the whole number.arrow_forwardSuppose a random sample of 459 married couples found that 307 had two or more personality preferences in common. In another random sample of 471 married couples, it was found that only 31 had no preferences in common. Let p1 be the population proportion of all married couples who have two or more personality preferences in common. Let p2 be the population proportion of all married couples who have no personality preferences in common. Find a95% confidence interval for . Round your answer to three decimal places.arrow_forward
- A history teacher interviewed a random sample of 80 students about their preferences in learning activities outside of school and whether they are considering watching a historical movie at the cinema. 69 answered that they would like to go to the cinema. Let p represent the proportion of students who want to watch a historical movie. Determine the maximal margin of error. Use α = 0.05. Round your answer to three decimal places. arrow_forwardA random sample of medical files is used to estimate the proportion p of all people who have blood type B. If you have no preliminary estimate for p, how many medical files should you include in a random sample in order to be 99% sure that the point estimate will be within a distance of 0.07 from p? Round your answer to the next higher whole number.arrow_forwardA clinical study is designed to assess the average length of hospital stay of patients who underwent surgery. A preliminary study of a random sample of 70 surgery patients’ records showed that the standard deviation of the lengths of stay of all surgery patients is 7.5 days. How large should a sample to estimate the desired mean to within 1 day at 95% confidence? Round your answer to the whole number.arrow_forward
- A clinical study is designed to assess the average length of hospital stay of patients who underwent surgery. A preliminary study of a random sample of 70 surgery patients’ records showed that the standard deviation of the lengths of stay of all surgery patients is 7.5 days. How large should a sample to estimate the desired mean to within 1 day at 95% confidence? Round your answer to the whole number.arrow_forwardIn the experiment a sample of subjects is drawn of people who have an elbow surgery. Each of the people included in the sample was interviewed about their health status and measurements were taken before and after surgery. Are the measurements before and after the operation independent or dependent samples?arrow_forwardiid 1. The CLT provides an approximate sampling distribution for the arithmetic average Ỹ of a random sample Y₁, . . ., Yn f(y). The parameters of the approximate sampling distribution depend on the mean and variance of the underlying random variables (i.e., the population mean and variance). The approximation can be written to emphasize this, using the expec- tation and variance of one of the random variables in the sample instead of the parameters μ, 02: YNEY, · (1 (EY,, varyi n For the following population distributions f, write the approximate distribution of the sample mean. (a) Exponential with rate ẞ: f(y) = ß exp{−ßy} 1 (b) Chi-square with degrees of freedom: f(y) = ( 4 ) 2 y = exp { — ½/ } г( (c) Poisson with rate λ: P(Y = y) = exp(-\} > y! y²arrow_forward
arrow_back_ios
SEE MORE QUESTIONS
arrow_forward_ios
Recommended textbooks for you
 Holt Mcdougal Larson Pre-algebra: Student Edition...AlgebraISBN:9780547587776Author:HOLT MCDOUGALPublisher:HOLT MCDOUGAL
 Glencoe Algebra 1, Student Edition, 9780079039897...AlgebraISBN:9780079039897Author:CarterPublisher:McGraw Hill
 Big Ideas Math A Bridge To Success Algebra 1: Stu...AlgebraISBN:9781680331141Author:HOUGHTON MIFFLIN HARCOURTPublisher:Houghton Mifflin Harcourt
Holt Mcdougal Larson Pre-algebra: Student Edition...
Algebra
ISBN:9780547587776
Author:HOLT MCDOUGAL
Publisher:HOLT MCDOUGAL
Glencoe Algebra 1, Student Edition, 9780079039897...
Algebra
ISBN:9780079039897
Author:Carter
Publisher:McGraw Hill
Big Ideas Math A Bridge To Success Algebra 1: Stu...
Algebra
ISBN:9781680331141
Author:HOUGHTON MIFFLIN HARCOURT
Publisher:Houghton Mifflin Harcourt
Hypothesis Testing using Confidence Interval Approach; Author: BUM2413 Applied Statistics UMP;https://www.youtube.com/watch?v=Hq1l3e9pLyY;License: Standard YouTube License, CC-BY
Hypothesis Testing - Difference of Two Means - Student's -Distribution & Normal Distribution; Author: The Organic Chemistry Tutor;https://www.youtube.com/watch?v=UcZwyzwWU7o;License: Standard Youtube License