
Intro Stats
4th Edition
ISBN: 9780321825278
Author: Richard D. De Veaux, Paul F. Velleman, David E. Bock
Publisher: PEARSON
expand_more
expand_more
format_list_bulleted
Concept explainers
Videos
Textbook Question
Chapter 4, Problem 28E
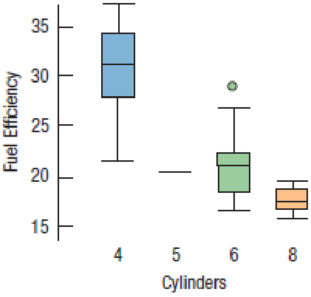
Fuel economy and cylinders Describe what these boxplots tell you about the relationship between the number of cylinders a car’s engine has and the car’s fuel economy (mpg).
Expert Solution & Answer
Want to see the full answer?
Check out a sample textbook solution
Students have asked these similar questions
Harvard University
California Institute of Technology
Massachusetts Institute of Technology
Stanford University
Princeton University
University of Cambridge
University of Oxford
University of California, Berkeley
Imperial College London
Yale University
University of California, Los Angeles
University of Chicago
Johns Hopkins University
Cornell University
ETH Zurich
University of Michigan
University of Toronto
Columbia University
University of Pennsylvania
Carnegie Mellon University
University of Hong Kong
University College London
University of Washington
Duke University
Northwestern University
University of Tokyo
Georgia Institute of Technology
Pohang University of Science and Technology
University of California, Santa Barbara
University of British Columbia
University of North Carolina at Chapel Hill
University of California, San Diego
University of Illinois at Urbana-Champaign
National University of Singapore
McGill…
Name
Harvard University
California Institute of Technology
Massachusetts Institute of Technology
Stanford University
Princeton University
University of Cambridge
University of Oxford
University of California, Berkeley
Imperial College London
Yale University
University of California, Los Angeles
University of Chicago
Johns Hopkins University
Cornell University
ETH Zurich
University of Michigan
University of Toronto
Columbia University
University of Pennsylvania
Carnegie Mellon University
University of Hong Kong
University College London
University of Washington
Duke University
Northwestern University
University of Tokyo
Georgia Institute of Technology
Pohang University of Science and Technology
University of California, Santa Barbara
University of British Columbia
University of North Carolina at Chapel Hill
University of California, San Diego
University of Illinois at Urbana-Champaign
National University of Singapore…
A company found that the daily sales revenue of its flagship product follows a normal distribution with a mean of $4500 and a standard deviation of $450. The company defines a "high-sales day" that is, any day with sales exceeding $4800. please provide a step by step on how to get the answers in excel
Q: What percentage of days can the company expect to have "high-sales days" or sales greater than $4800?
Q: What is the sales revenue threshold for the bottom 10% of days? (please note that 10% refers to the probability/area under bell curve towards the lower tail of bell curve)
Provide answers in the yellow cells
Chapter 4 Solutions
Intro Stats
Ch. 4.2 - The Bureau of Transportation Statistics of the...Ch. 4.2 - The Bureau of Transportation Statistics of the...Ch. 4.2 - Prob. 3JCCh. 4 - Prob. 1ECh. 4 - Prob. 2ECh. 4 - Prob. 3ECh. 4 - 4. Load factors by year Here is a display of the...Ch. 4 - Prob. 5ECh. 4 - Prob. 6ECh. 4 - Prob. 7E
Ch. 4 - Prob. 8ECh. 4 - Prob. 9ECh. 4 - Exoplanets re-expressed Here are the exoplanet...Ch. 4 - Prob. 15ECh. 4 - Prob. 16ECh. 4 - Prob. 17ECh. 4 - Prob. 18ECh. 4 - Sugar in cereals Sugar is a major ingredient in...Ch. 4 - Tendon transfers People with spinal cord injuries...Ch. 4 - Prob. 21ECh. 4 - Camp sites Shown below are the histogram and...Ch. 4 - Hospital stays The U.S. National Center for Health...Ch. 4 - Prob. 24ECh. 4 - Womens basketball Here are boxplots of the points...Ch. 4 - Prob. 26ECh. 4 - Marriage age In 1975, did men and women marry at...Ch. 4 - Fuel economy and cylinders Describe what these...Ch. 4 - Prob. 29ECh. 4 - Ozone Ozone levels (in parts per billion, ppb)...Ch. 4 - Test scores Three statistics classes all took the...Ch. 4 - Prob. 32ECh. 4 - Graduation? A survey of major universities asked...Ch. 4 - Vineyards Here are summary statistics for the...Ch. 4 - Caffeine A student study of the effects of...Ch. 4 - SAT scores Here are the summary statistics for...Ch. 4 - Prob. 37ECh. 4 - Framingham cholesterol The Framingham Heart Study...Ch. 4 - Prob. 39ECh. 4 - Cloud seeding In an experiment to determine...Ch. 4 - Industrial experiment Engineers at a computer...Ch. 4 - Cholesterol and smoking A study that examined the...Ch. 4 - Prob. 43ECh. 4 - Prob. 44ECh. 4 - Prob. 45ECh. 4 - Prob. 46ECh. 4 - Assets Here is a histogram of the assets (in...Ch. 4 - Prob. 48ECh. 4 - Assets again Here are the same data you saw in...Ch. 4 - Rainmakers The table lists the amounts of rainfall...Ch. 4 - Stereograms Stereograms appear to be composed...Ch. 4 - Stereograms, revisited Because of the skewness of...
Additional Math Textbook Solutions
Find more solutions based on key concepts
For Exercises 13–18, write the negation of the statement.
13. The cell phone is out of juice.
Math in Our World
Find all solutions of each equation in the interval .
Precalculus: A Unit Circle Approach (3rd Edition)
Reading, Writing, and Rounding Whole Numbers Write in words. 357
Mathematics for the Trades: A Guided Approach (11th Edition) (What's New in Trade Math)
1. How is a sample related to a population?
Elementary Statistics: Picturing the World (7th Edition)
Check Your Understanding
Reading Check Complete each sentence using > or < for □.
RC1. 3 dm □ 3 dam
Basic College Mathematics
Knowledge Booster


Learn more about
Need a deep-dive on the concept behind this application? Look no further. Learn more about this topic, statistics and related others by exploring similar questions and additional content below.Similar questions
- Find the critical value for a left-tailed test using the F distribution with a 0.025, degrees of freedom in the numerator=12, and degrees of freedom in the denominator = 50. A portion of the table of critical values of the F-distribution is provided. Click the icon to view the partial table of critical values of the F-distribution. What is the critical value? (Round to two decimal places as needed.)arrow_forwardA retail store manager claims that the average daily sales of the store are $1,500. You aim to test whether the actual average daily sales differ significantly from this claimed value. You can provide your answer by inserting a text box and the answer must include: Null hypothesis, Alternative hypothesis, Show answer (output table/summary table), and Conclusion based on the P value. Showing the calculation is a must. If calculation is missing,so please provide a step by step on the answers Numerical answers in the yellow cellsarrow_forwardShow all workarrow_forward
- Show all workarrow_forwardplease find the answers for the yellows boxes using the information and the picture belowarrow_forwardA marketing agency wants to determine whether different advertising platforms generate significantly different levels of customer engagement. The agency measures the average number of daily clicks on ads for three platforms: Social Media, Search Engines, and Email Campaigns. The agency collects data on daily clicks for each platform over a 10-day period and wants to test whether there is a statistically significant difference in the mean number of daily clicks among these platforms. Conduct ANOVA test. You can provide your answer by inserting a text box and the answer must include: also please provide a step by on getting the answers in excel Null hypothesis, Alternative hypothesis, Show answer (output table/summary table), and Conclusion based on the P value.arrow_forward
arrow_back_ios
SEE MORE QUESTIONS
arrow_forward_ios
Recommended textbooks for you
 Glencoe Algebra 1, Student Edition, 9780079039897...AlgebraISBN:9780079039897Author:CarterPublisher:McGraw Hill
 Holt Mcdougal Larson Pre-algebra: Student Edition...AlgebraISBN:9780547587776Author:HOLT MCDOUGALPublisher:HOLT MCDOUGAL
 Elementary AlgebraAlgebraISBN:9780998625713Author:Lynn Marecek, MaryAnne Anthony-SmithPublisher:OpenStax - Rice University
 College AlgebraAlgebraISBN:9781305115545Author:James Stewart, Lothar Redlin, Saleem WatsonPublisher:Cengage Learning
 Algebra and Trigonometry (MindTap Course List)AlgebraISBN:9781305071742Author:James Stewart, Lothar Redlin, Saleem WatsonPublisher:Cengage Learning
 Functions and Change: A Modeling Approach to Coll...AlgebraISBN:9781337111348Author:Bruce Crauder, Benny Evans, Alan NoellPublisher:Cengage Learning
Glencoe Algebra 1, Student Edition, 9780079039897...
Algebra
ISBN:9780079039897
Author:Carter
Publisher:McGraw Hill
Holt Mcdougal Larson Pre-algebra: Student Edition...
Algebra
ISBN:9780547587776
Author:HOLT MCDOUGAL
Publisher:HOLT MCDOUGAL
Elementary Algebra
Algebra
ISBN:9780998625713
Author:Lynn Marecek, MaryAnne Anthony-Smith
Publisher:OpenStax - Rice University
College Algebra
Algebra
ISBN:9781305115545
Author:James Stewart, Lothar Redlin, Saleem Watson
Publisher:Cengage Learning
Algebra and Trigonometry (MindTap Course List)
Algebra
ISBN:9781305071742
Author:James Stewart, Lothar Redlin, Saleem Watson
Publisher:Cengage Learning
Functions and Change: A Modeling Approach to Coll...
Algebra
ISBN:9781337111348
Author:Bruce Crauder, Benny Evans, Alan Noell
Publisher:Cengage Learning
Correlation Vs Regression: Difference Between them with definition & Comparison Chart; Author: Key Differences;https://www.youtube.com/watch?v=Ou2QGSJVd0U;License: Standard YouTube License, CC-BY
Correlation and Regression: Concepts with Illustrative examples; Author: LEARN & APPLY : Lean and Six Sigma;https://www.youtube.com/watch?v=xTpHD5WLuoA;License: Standard YouTube License, CC-BY