
Stats: Modeling the World Nasta Edition Grades 9-12
3rd Edition
ISBN: 9780131359581
Author: David E. Bock, Paul F. Velleman, Richard D. De Veaux
Publisher: PEARSON
expand_more
expand_more
format_list_bulleted
Concept explainers
Videos
Question
Chapter 4, Problem 17E
To determine
To Explain: the summary statistics for the centre and spread in these data.
Expert Solution & Answer
Answer to Problem 17E
Explanation of Solution
Given:
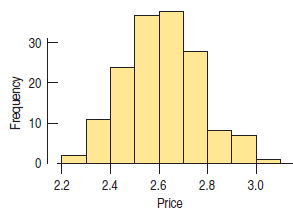
By seeing the histogram, it is observed that, it is approximately symmetric and unimodal. Mean and standard deviation would be the best measure of the centre because of symmetric histogram. So the mean and standard deviation is the well summarizes the centre and spread of the data.
Chapter 4 Solutions
Stats: Modeling the World Nasta Edition Grades 9-12
Ch. 4 - Prob. 5ECh. 4 - Prob. 6ECh. 4 - Prob. 7ECh. 4 - Prob. 8ECh. 4 - Prob. 9ECh. 4 - Prob. 10ECh. 4 - Prob. 11ECh. 4 - Prob. 12ECh. 4 - Prob. 13ECh. 4 - Prob. 14E
Ch. 4 - Prob. 15ECh. 4 - Prob. 16ECh. 4 - Prob. 17ECh. 4 - Prob. 18ECh. 4 - Prob. 19ECh. 4 - Prob. 20ECh. 4 - Prob. 21ECh. 4 - Prob. 22ECh. 4 - Prob. 23ECh. 4 - Prob. 24ECh. 4 - Prob. 25ECh. 4 - Prob. 26ECh. 4 - Prob. 27ECh. 4 - Prob. 28ECh. 4 - Prob. 29ECh. 4 - Prob. 30ECh. 4 - Prob. 31ECh. 4 - Prob. 32ECh. 4 - Prob. 33ECh. 4 - Prob. 34ECh. 4 - Prob. 35ECh. 4 - Prob. 36ECh. 4 - Prob. 37ECh. 4 - Prob. 38ECh. 4 - Prob. 39ECh. 4 - Prob. 40ECh. 4 - Prob. 41ECh. 4 - Prob. 42ECh. 4 - Prob. 43ECh. 4 - Prob. 44ECh. 4 - Prob. 45ECh. 4 - Prob. 46ECh. 4 - Prob. 47ECh. 4 - Prob. 48ECh. 4 - Prob. 49ECh. 4 - Prob. 50E
Additional Math Textbook Solutions
Find more solutions based on key concepts
Interpreting a Decision In Exercises 43–48, determine whether the claim represents the null hypothesis or the a...
Elementary Statistics: Picturing the World (7th Edition)
Assessment 1-1A Cookies are sold singly or in packages of 2 or 6. With this packaging, how many ways can you bu...
A Problem Solving Approach To Mathematics For Elementary School Teachers (13th Edition)
CHECK POINT 1 Find a counterexample to show that the statement The product of two two-digit numbers is a three-...
Thinking Mathematically (6th Edition)
Using Technology. In Exercises 5–8, identify the indicated values or interpret the given display. Use the norma...
Elementary Statistics (13th Edition)
3. Voluntary Response Sample What is a voluntary response sample, and why is such a sample generally not suitab...
Elementary Statistics
Explain the meaning of the term “statistically significant difference” in statistics terminology.
Intro Stats, Books a la Carte Edition (5th Edition)
Knowledge Booster


Learn more about
Need a deep-dive on the concept behind this application? Look no further. Learn more about this topic, statistics and related others by exploring similar questions and additional content below.Similar questions
- Find the critical value for a left-tailed test using the F distribution with a 0.025, degrees of freedom in the numerator=12, and degrees of freedom in the denominator = 50. A portion of the table of critical values of the F-distribution is provided. Click the icon to view the partial table of critical values of the F-distribution. What is the critical value? (Round to two decimal places as needed.)arrow_forwardA retail store manager claims that the average daily sales of the store are $1,500. You aim to test whether the actual average daily sales differ significantly from this claimed value. You can provide your answer by inserting a text box and the answer must include: Null hypothesis, Alternative hypothesis, Show answer (output table/summary table), and Conclusion based on the P value. Showing the calculation is a must. If calculation is missing,so please provide a step by step on the answers Numerical answers in the yellow cellsarrow_forwardShow all workarrow_forward
- Show all workarrow_forwardplease find the answers for the yellows boxes using the information and the picture belowarrow_forwardA marketing agency wants to determine whether different advertising platforms generate significantly different levels of customer engagement. The agency measures the average number of daily clicks on ads for three platforms: Social Media, Search Engines, and Email Campaigns. The agency collects data on daily clicks for each platform over a 10-day period and wants to test whether there is a statistically significant difference in the mean number of daily clicks among these platforms. Conduct ANOVA test. You can provide your answer by inserting a text box and the answer must include: also please provide a step by on getting the answers in excel Null hypothesis, Alternative hypothesis, Show answer (output table/summary table), and Conclusion based on the P value.arrow_forward
arrow_back_ios
SEE MORE QUESTIONS
arrow_forward_ios
Recommended textbooks for you
 MATLAB: An Introduction with ApplicationsStatisticsISBN:9781119256830Author:Amos GilatPublisher:John Wiley & Sons Inc
 Probability and Statistics for Engineering and th...StatisticsISBN:9781305251809Author:Jay L. DevorePublisher:Cengage Learning
 Statistics for The Behavioral Sciences (MindTap C...StatisticsISBN:9781305504912Author:Frederick J Gravetter, Larry B. WallnauPublisher:Cengage Learning
 Elementary Statistics: Picturing the World (7th E...StatisticsISBN:9780134683416Author:Ron Larson, Betsy FarberPublisher:PEARSON
 The Basic Practice of StatisticsStatisticsISBN:9781319042578Author:David S. Moore, William I. Notz, Michael A. FlignerPublisher:W. H. Freeman
 Introduction to the Practice of StatisticsStatisticsISBN:9781319013387Author:David S. Moore, George P. McCabe, Bruce A. CraigPublisher:W. H. Freeman
MATLAB: An Introduction with Applications
Statistics
ISBN:9781119256830
Author:Amos Gilat
Publisher:John Wiley & Sons Inc
Probability and Statistics for Engineering and th...
Statistics
ISBN:9781305251809
Author:Jay L. Devore
Publisher:Cengage Learning
Statistics for The Behavioral Sciences (MindTap C...
Statistics
ISBN:9781305504912
Author:Frederick J Gravetter, Larry B. Wallnau
Publisher:Cengage Learning
Elementary Statistics: Picturing the World (7th E...
Statistics
ISBN:9780134683416
Author:Ron Larson, Betsy Farber
Publisher:PEARSON
The Basic Practice of Statistics
Statistics
ISBN:9781319042578
Author:David S. Moore, William I. Notz, Michael A. Fligner
Publisher:W. H. Freeman
Introduction to the Practice of Statistics
Statistics
ISBN:9781319013387
Author:David S. Moore, George P. McCabe, Bruce A. Craig
Publisher:W. H. Freeman
The Shape of Data: Distributions: Crash Course Statistics #7; Author: CrashCourse;https://www.youtube.com/watch?v=bPFNxD3Yg6U;License: Standard YouTube License, CC-BY
Shape, Center, and Spread - Module 20.2 (Part 1); Author: Mrmathblog;https://www.youtube.com/watch?v=COaid7O_Gag;License: Standard YouTube License, CC-BY
Shape, Center and Spread; Author: Emily Murdock;https://www.youtube.com/watch?v=_YyW0DSCzpM;License: Standard Youtube License