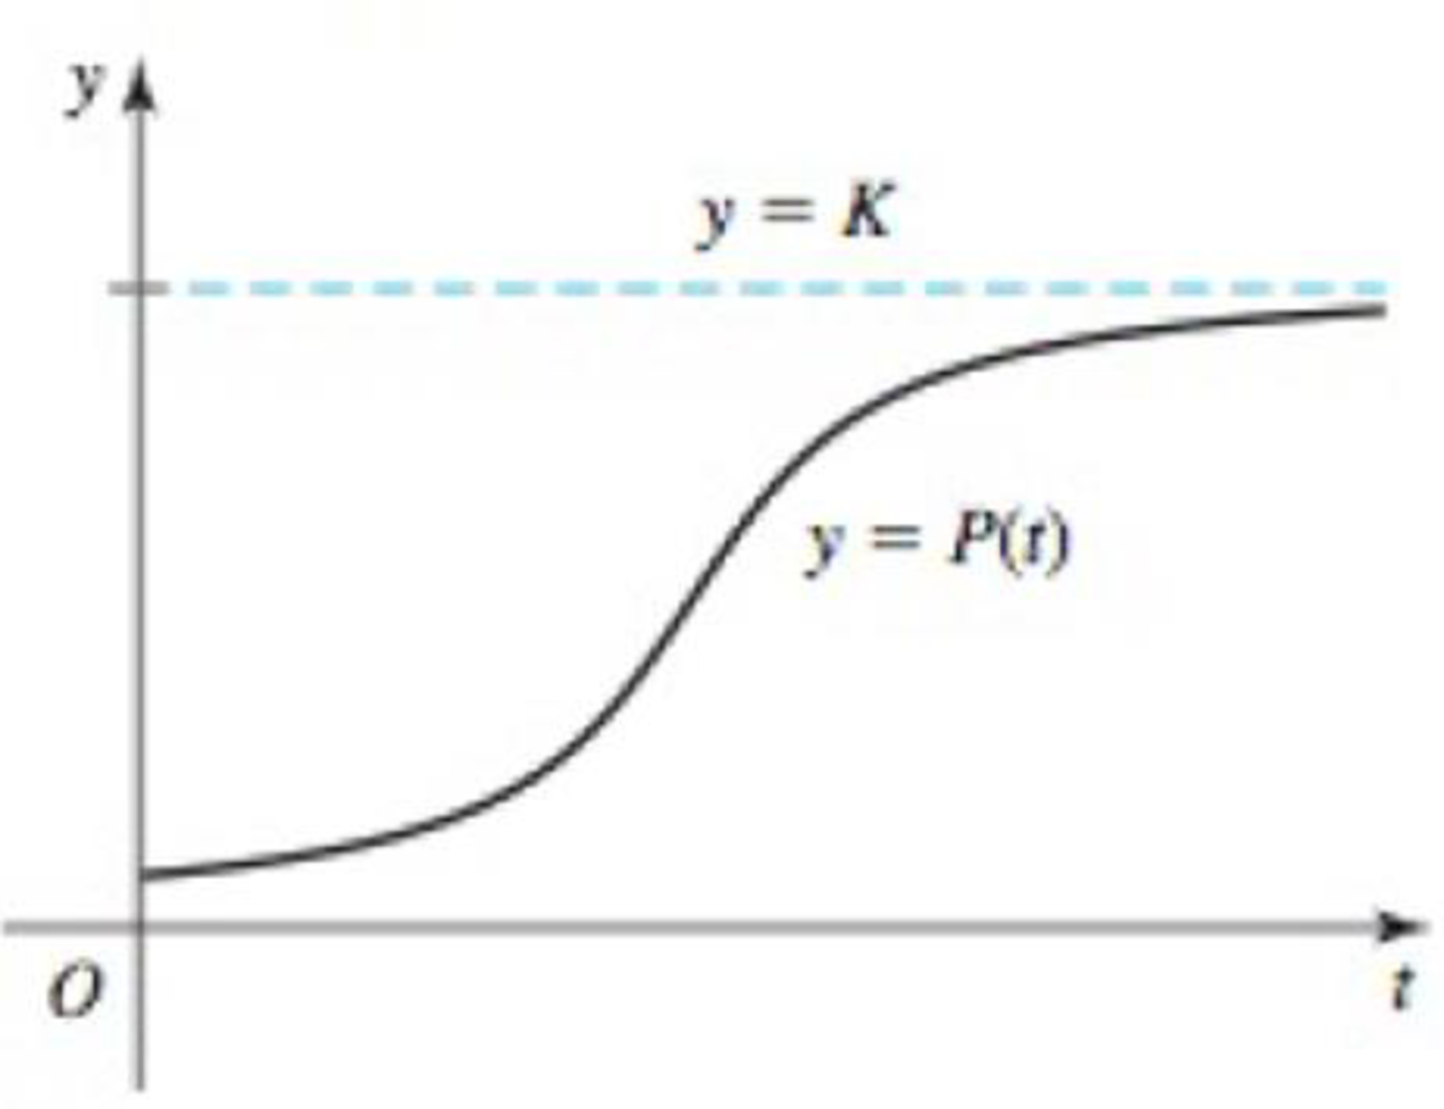
Logistic growth Scientists often use the logistic growth function

96. Population crash The logistic model can be used for situations in which the initial population P0 is above the carrying capacity K. For example, consider a deer population of 1500 on an island where a fire has reduced the carrying capacity to 1000 deer.
- a. Assuming a base growth rate of r0 = 0.1 and an initial population of P(0) = 1500, write a logistic growth function for the deer population and graph it. Based on the graph, what happens to the deer population in the long run?
- b. How fast (in deer per year) is the population declining immediately after the fire at t = 0?
- c. How long does it take the deer population to decline to 1200 deer?
Want to see the full answer?
Check out a sample textbook solution
Chapter 3 Solutions
MyLab Math with Pearson eText -- Standalone Access Card -- for Calculus: Early Transcendentals (3rd Edition)
Additional Math Textbook Solutions
A Problem Solving Approach To Mathematics For Elementary School Teachers (13th Edition)
Elementary Statistics: Picturing the World (7th Edition)
A First Course in Probability (10th Edition)
Intro Stats, Books a la Carte Edition (5th Edition)
Precalculus
Basic Business Statistics, Student Value Edition
- Draw the asymptotes (if there are any). Then plot two points on each piece of the graph.arrow_forwardCancel Done RESET Suppose that R(x) is a polynomial of degree 7 whose coefficients are real numbers. Also, suppose that R(x) has the following zeros. -1-4i, -3i, 5+i Answer the following. (a) Find another zero of R(x). ☐ | | | | |│ | | | -1 བ ¢ Live Adjust Filters Croparrow_forwardSuppose that R (x) is a polynomial of degree 7 whose coefficients are real numbers. Also, suppose that R (x) has the following zeros. -1-4i, -3i, 5+i Answer the following. (c) What is the maximum number of nonreal zeros that R (x) can have? ☐arrow_forward
- Suppose that R (x) is a polynomial of degree 7 whose coefficients are real numbers. Also, suppose that R (x) has the following zeros. -1-4i, -3i, 5+i Answer the following. (b) What is the maximum number of real zeros that R (x) can have? ☐arrow_forwardi need help please dont use chat gptarrow_forward3.1 Limits 1. If lim f(x)=-6 and lim f(x)=5, then lim f(x). Explain your choice. x+3° x+3* x+3 (a) Is 5 (c) Does not exist (b) is 6 (d) is infinitearrow_forward
- 1 pts Let F and G be vector fields such that ▼ × F(0, 0, 0) = (0.76, -9.78, 3.29), G(0, 0, 0) = (−3.99, 6.15, 2.94), and G is irrotational. Then sin(5V (F × G)) at (0, 0, 0) is Question 1 -0.246 0.072 -0.934 0.478 -0.914 -0.855 0.710 0.262 .arrow_forward2. Answer the following questions. (A) [50%] Given the vector field F(x, y, z) = (x²y, e", yz²), verify the differential identity Vx (VF) V(V •F) - V²F (B) [50%] Remark. You are confined to use the differential identities. Let u and v be scalar fields, and F be a vector field given by F = (Vu) x (Vv) (i) Show that F is solenoidal (or incompressible). (ii) Show that G = (uvv – vVu) is a vector potential for F.arrow_forwardA driver is traveling along a straight road when a buffalo runs into the street. This driver has a reaction time of 0.75 seconds. When the driver sees the buffalo he is traveling at 44 ft/s, his car can decelerate at 2 ft/s^2 when the brakes are applied. What is the stopping distance between when the driver first saw the buffalo, to when the car stops.arrow_forward
- Topic 2 Evaluate S x dx, using u-substitution. Then find the integral using 1-x2 trigonometric substitution. Discuss the results! Topic 3 Explain what an elementary anti-derivative is. Then consider the following ex integrals: fed dx x 1 Sdx In x Joseph Liouville proved that the first integral does not have an elementary anti- derivative Use this fact to prove that the second integral does not have an elementary anti-derivative. (hint: use an appropriate u-substitution!)arrow_forward1. Given the vector field F(x, y, z) = -xi, verify the relation 1 V.F(0,0,0) = lim 0+ volume inside Se ff F• Nds SE where SE is the surface enclosing a cube centred at the origin and having edges of length 2€. Then, determine if the origin is sink or source.arrow_forward4 3 2 -5 4-3 -2 -1 1 2 3 4 5 12 23 -4 The function graphed above is: Increasing on the interval(s) Decreasing on the interval(s)arrow_forward
- Algebra & Trigonometry with Analytic GeometryAlgebraISBN:9781133382119Author:SwokowskiPublisher:Cengage


 Glencoe Algebra 1, Student Edition, 9780079039897...AlgebraISBN:9780079039897Author:CarterPublisher:McGraw Hill
 Linear Algebra: A Modern IntroductionAlgebraISBN:9781285463247Author:David PoolePublisher:Cengage Learning
 College AlgebraAlgebraISBN:9781305115545Author:James Stewart, Lothar Redlin, Saleem WatsonPublisher:Cengage Learning


