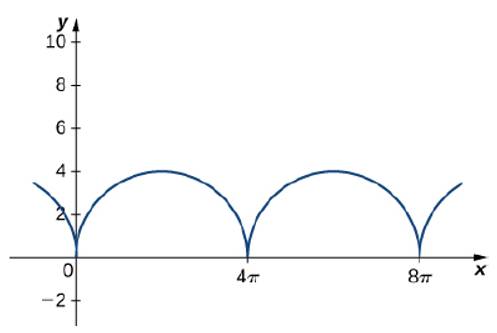
Consider the motion of a point on the circumference of a rolling circle. As the circle rolls, it generates the cycloid r ( t ) = ( ω t − sin ( ω t ) ) i + ( 1 − cos ( ω t ) ) j , where to is the angular velocity of the circle and b is the radius of the circle: 165. Find the equations for the velocity, acceleration, and speed of the particle at any time.
Consider the motion of a point on the circumference of a rolling circle. As the circle rolls, it generates the cycloid r ( t ) = ( ω t − sin ( ω t ) ) i + ( 1 − cos ( ω t ) ) j , where to is the angular velocity of the circle and b is the radius of the circle: 165. Find the equations for the velocity, acceleration, and speed of the particle at any time.
Consider the motion of a point on the circumference of a rolling circle. As the circle rolls, it generates the cycloid
r
(
t
)
=
(
ω
t
−
sin
(
ω
t
)
)
i
+
(
1
−
cos
(
ω
t
)
)
j
, where to is the angular velocity of the circle and b is the radius of the circle:
165. Find the equations for the velocity, acceleration, and speed of the particle at any time.
.
The students who attend Memorial High School have a wide variety of extra-curricular activities to choose from in the after-school program. Students are 38% likely to join the dance team; 18% likely to participate in the school play; 42% likely to join the yearbook club; and 64% likely to join the marching band. Many students choose to participate in multiple activities. Students have equal probabilities of being freshmen, sophomores, juniors, or seniors.What is the probability of the union of being either a freshman or senior?
0.07
0.44
0.50
0.25
Explain the conditions under which the Radius of Convergence of the Power Series is a "finite positive real number" r>0
Need a deep-dive on the concept behind this application? Look no further. Learn more about this topic, subject and related others by exploring similar questions and additional content below.


 Trigonometry (MindTap Course List)TrigonometryISBN:9781305652224Author:Charles P. McKeague, Mark D. TurnerPublisher:Cengage Learning
 Algebra and Trigonometry (MindTap Course List)AlgebraISBN:9781305071742Author:James Stewart, Lothar Redlin, Saleem WatsonPublisher:Cengage Learning
 Algebra & Trigonometry with Analytic GeometryAlgebraISBN:9781133382119Author:SwokowskiPublisher:Cengage
 Linear Algebra: A Modern IntroductionAlgebraISBN:9781285463247Author:David PoolePublisher:Cengage Learning