Concept explainers
Videos
a.
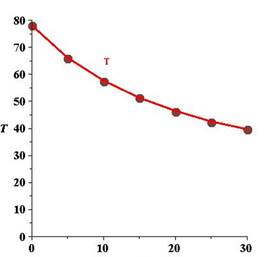
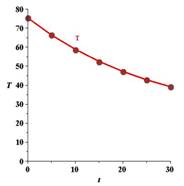
Plot the data points
a.
Answer to Problem 95E

Explanation of Solution
Given information:
A cup of water at an initial temperature of
The graph of the model for the data should be asymptotic with the graph of the temperature of the room. Subtract the room temperature from each of the temperatures in the ordered pairs. Usa a graphing utility to plot the data points
Calculation:
The initial temperature of
After subtracting the room temperature, the result is shown in the table below:
The graph corresponding to

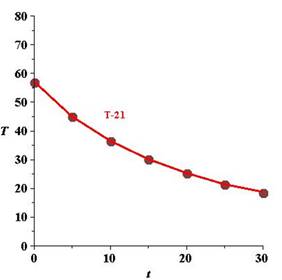
Hence, the result.
b.
Solve for
Compare the result.
b.
Answer to Problem 95E
There is not much variation between the two graphs.
Explanation of Solution
Given information:
A cup of water at an initial temperature of
An exponential model for the data
Calculation:
The initial temperature of
The exponential model for the data
By giving different values to
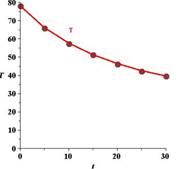
The graph corresponding to the model is given below:
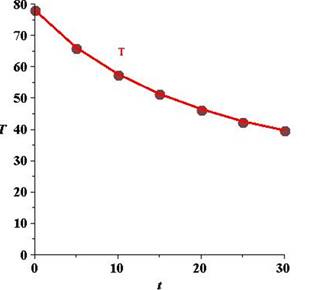
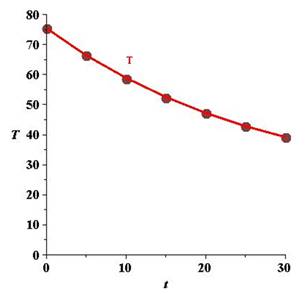
Hence, on compairing the model output with the original data we will see that there is not much variation between the two graphs..
c.
Solve for
c.
Answer to Problem 95E
This equation is equivalent to model equation.
Explanation of Solution
Given information:
A cup of water at an initial temperature of
Take the natural logrithms of the revised temperatures. Use the graphing utility to plot the points
Calculation:
The initial temperature of
After subtracting the room temperature, the result is shown in the table below:
Taking the natural logarithm of the revised temperature,
The graph corresponding to
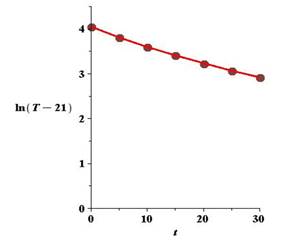
The slope of the line is calculated by taking any two points. So let us consider these points as
By the point-slope form, the equation of the line is,
where
Now, solving for
Hence, the above equation is equivalent to model equation.
d.
Solve for
d.
Answer to Problem 95E
Explanation of Solution
Given information:
A cup of water at an initial temperature of
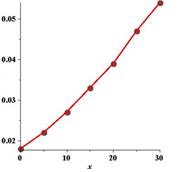
Fit a rational model to the data. Take the recprocals of the
Use the graphing utility to graph these points and observe that the points appear to be linear. Use the regression feature of the graphing utility to fit a line to these data. This resulting line has the form
Solve for
Calculation:
The initial temperature of
Now, on taking the reciprocals of the
The graph corresponding to
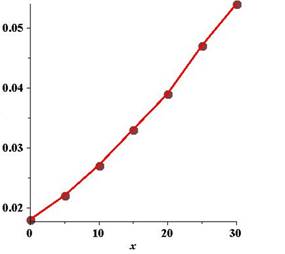
The slope of the line is calculated by taking any two points. So let us consider these points as
By the point-slope form, the equation of the line is,
where
The above equation has the form
Now, solving for
Hence,
e.
Why did taking the logarithms and reciprocals of the temperatures lead to a linear
e.
Answer to Problem 95E
Both the logarithmic and reciprocal functions of time vary linearly.
Explanation of Solution
Given information:
A cup of water at an initial temperature of
Why did taking the logarithms of the temperatures lead to a linear scatter plot? Why did taling the reciprocals of the temperatures lead to a linear sactter plot?
Calculation:
Both the logarithmic and reciprocal functions of time vary linearly.
Hence, the scatter plot gives a linear plot.
Chapter 3 Solutions
Precalculus with Limits


- A Content X MindTap - Cengage Learning x Function Evaluations x + /ui/evo/index.html?elSBN=9780357038406&id=339416021&snapshotld=877369& GE MINDTAP , Limits, and the Derivative ⭑ វា a ANSWEI 16. Refer to the graph of the function f in the following figure. कर्ट AA C 54 -3-2 7 7 Ay 6. S 5. y=f(x) 4 3. 2. 1 -3- 34567 8 00 9 10 a. Find the value of ƒ (7). b. Find the values of x corresponding to the point(s) on the graph of ƒ located at a height of 5 units from the x-axis. c. Find the point on the x-axis at which the graph of ƒ crosses it. What is the value of f (x) at this point? d. Find the domain and range of f. MacBook Pro G Search or type URL + > % Λ & 5 6 7 29 ( 8 9 0arrow_forwardMorgan F. - C X A Courses MindTap - Cengage Learning Х Domain of Square Roots X + gage.com/static/nb/ui/evo/index.html?elSBN 9780357038406&id=339416021&snapshotld=877369& CENGAGE MINDTAP 2: Functions, Limits, and the Derivative 47. x if x < 0 f(x) = 2x+1 if x 0 Answerarrow_forwardA Content MindTap - Cengage Learning × Function Evaluations * + c/nb/ui/evo/index.html?elSBN 9780357038406&id=339416021&snapshotld=877369& GAGE MINDTAP ions, Limits, and the Derivative 15. Refer to the graph of the function f in the following figure. 6 y = f(x) 5 4+ 3- 2- 1 + 2 -1 3 4 5 6 a. Find the value of ƒ (0). Answer-> b. Find the value of x for which (i) f (x) = 3 and (ii) f (x) = 0. Answer ▾ c. Find the domain of f. Answer + d. Find the range of f. Answer+ MacBook Proarrow_forward
- Answer-> 12. Let g be the function defined by Find g(-2), g(0), g (2), and g (4). - +1 if x <2 g(x) = √√√x-2 if x 2arrow_forward13. Let f be the function defined by Find f (-1), f (0), ƒ (1) and ƒ (2). Answer f(x) = .2 J-x² +3 if x <1 2x²+1 2x²+1 if x ≥ 1arrow_forwardΛ Content Mind Tap - Cengage Learning × Function Evaluations x + c/nb/ui/evo/index.html?elSBN 9780357038406&id=339416021&snapshotld=877369& GAGE MINDTAP ons, Limits, and the Derivative 14. Let f be the function defined by Find f (0), f (1), and f (2). 2+1 x if x 1 if x 1 f(x) = 1 1-xarrow_forward
- A Content c/nb/ui/evo/index.html?elSBN 9780357038406&id=339416021&snapshotld=877369& GAGE MINDTAP ons, Limits, and the Derivative 11. Let f be the function defined by Find f (-2), f (0), and f (1). Answer f(x) = [ x² + 1 if x ≤ 0 if x > 0arrow_forwardGiven that 4−4i is a zero, factor the following polynomial function completely. Use the Conjugate Roots Theorem, if applicable. f(x)=x4−5x3−2x2+176x−320arrow_forwardeliminate the parameter to find the cartesian equation of the curve and sketch the graph. On the graph show the direction it takes and the initial and terminal point. Please draw by hand and show how you got to each steparrow_forward
 Calculus: Early TranscendentalsCalculusISBN:9781285741550Author:James StewartPublisher:Cengage Learning
 Thomas' Calculus (14th Edition)CalculusISBN:9780134438986Author:Joel R. Hass, Christopher E. Heil, Maurice D. WeirPublisher:PEARSON
 Calculus: Early Transcendentals (3rd Edition)CalculusISBN:9780134763644Author:William L. Briggs, Lyle Cochran, Bernard Gillett, Eric SchulzPublisher:PEARSON
 Calculus: Early TranscendentalsCalculusISBN:9781319050740Author:Jon Rogawski, Colin Adams, Robert FranzosaPublisher:W. H. Freeman
 Calculus: Early Transcendental FunctionsCalculusISBN:9781337552516Author:Ron Larson, Bruce H. EdwardsPublisher:Cengage Learning