Concept explainers
Videos
a.
Use a graphing utility to create a
a.
Answer to Problem 24PS
Explanation of Solution
Calculation:
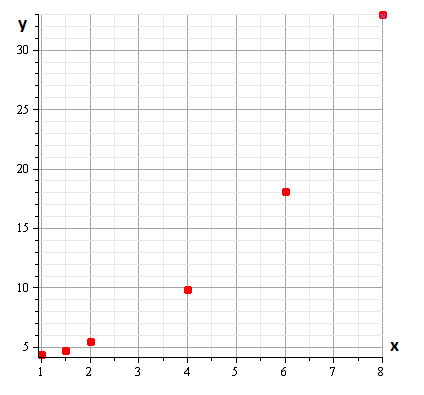
Consider the following data ,
Now draw the scatter plot,

Hence, the scatter plot is drawn.
b.
Verify that the data could best be modelled by a linear model, an exponential model, or a logarithmic model,
b.
Answer to Problem 24PS
Explanation of Solution
Given information:
Decide whether the data could best be modelled by a linear model, an exponential model, or a logarithmic model,
Calculation:
Consider the following data ,
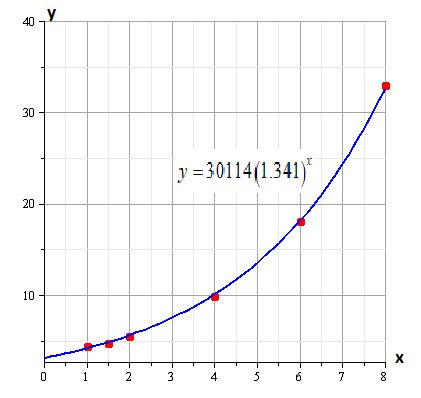
The best model for this data is exponential model.
Hence, the best model is
c.
Explain the model is an exponential model.
c.
Answer to Problem 24PS
Points are growing rapidly,non-linearly.
Explanation of Solution
Calculation:
Consider the following data ,
The best model for this data is exponential model.
It is observed from the graph that points are increasing non-linearly, thus we cannot use a linear model for this condition, it is also that points are growing rapidly thus exponential model is best suited .
Hence, we choose exponential model.
d.
To find the model is an exponential model for the data and graph the model with the scatter plot.
d.
Answer to Problem 24PS
Explanation of Solution
Calculation:
Consider the following data ,
By using the value of
Hence the required model is ,
Now scatter plot for this model,

Hence, the required model is
e.
Describe the model you chose fits the data.
e.
Answer to Problem 24PS
Model fits the data.
Explanation of Solution
Calculation:
Consider the required model is ,
Now scatter plot for this model,

The graph shows model fits the data,
Hence, the model fits the data.
Chapter 3 Solutions
Precalculus with Limits


- A Content X MindTap - Cengage Learning x Function Evaluations x + /ui/evo/index.html?elSBN=9780357038406&id=339416021&snapshotld=877369& GE MINDTAP , Limits, and the Derivative ⭑ វា a ANSWEI 16. Refer to the graph of the function f in the following figure. कर्ट AA C 54 -3-2 7 7 Ay 6. S 5. y=f(x) 4 3. 2. 1 -3- 34567 8 00 9 10 a. Find the value of ƒ (7). b. Find the values of x corresponding to the point(s) on the graph of ƒ located at a height of 5 units from the x-axis. c. Find the point on the x-axis at which the graph of ƒ crosses it. What is the value of f (x) at this point? d. Find the domain and range of f. MacBook Pro G Search or type URL + > % Λ & 5 6 7 29 ( 8 9 0arrow_forwardMorgan F. - C X A Courses MindTap - Cengage Learning Х Domain of Square Roots X + gage.com/static/nb/ui/evo/index.html?elSBN 9780357038406&id=339416021&snapshotld=877369& CENGAGE MINDTAP 2: Functions, Limits, and the Derivative 47. x if x < 0 f(x) = 2x+1 if x 0 Answerarrow_forwardA Content MindTap - Cengage Learning × Function Evaluations * + c/nb/ui/evo/index.html?elSBN 9780357038406&id=339416021&snapshotld=877369& GAGE MINDTAP ions, Limits, and the Derivative 15. Refer to the graph of the function f in the following figure. 6 y = f(x) 5 4+ 3- 2- 1 + 2 -1 3 4 5 6 a. Find the value of ƒ (0). Answer-> b. Find the value of x for which (i) f (x) = 3 and (ii) f (x) = 0. Answer ▾ c. Find the domain of f. Answer + d. Find the range of f. Answer+ MacBook Proarrow_forward
- Answer-> 12. Let g be the function defined by Find g(-2), g(0), g (2), and g (4). - +1 if x <2 g(x) = √√√x-2 if x 2arrow_forward13. Let f be the function defined by Find f (-1), f (0), ƒ (1) and ƒ (2). Answer f(x) = .2 J-x² +3 if x <1 2x²+1 2x²+1 if x ≥ 1arrow_forwardΛ Content Mind Tap - Cengage Learning × Function Evaluations x + c/nb/ui/evo/index.html?elSBN 9780357038406&id=339416021&snapshotld=877369& GAGE MINDTAP ons, Limits, and the Derivative 14. Let f be the function defined by Find f (0), f (1), and f (2). 2+1 x if x 1 if x 1 f(x) = 1 1-xarrow_forward
- A Content c/nb/ui/evo/index.html?elSBN 9780357038406&id=339416021&snapshotld=877369& GAGE MINDTAP ons, Limits, and the Derivative 11. Let f be the function defined by Find f (-2), f (0), and f (1). Answer f(x) = [ x² + 1 if x ≤ 0 if x > 0arrow_forwardGiven that 4−4i is a zero, factor the following polynomial function completely. Use the Conjugate Roots Theorem, if applicable. f(x)=x4−5x3−2x2+176x−320arrow_forwardeliminate the parameter to find the cartesian equation of the curve and sketch the graph. On the graph show the direction it takes and the initial and terminal point. Please draw by hand and show how you got to each steparrow_forward
 Calculus: Early TranscendentalsCalculusISBN:9781285741550Author:James StewartPublisher:Cengage Learning
 Thomas' Calculus (14th Edition)CalculusISBN:9780134438986Author:Joel R. Hass, Christopher E. Heil, Maurice D. WeirPublisher:PEARSON
 Calculus: Early Transcendentals (3rd Edition)CalculusISBN:9780134763644Author:William L. Briggs, Lyle Cochran, Bernard Gillett, Eric SchulzPublisher:PEARSON
 Calculus: Early TranscendentalsCalculusISBN:9781319050740Author:Jon Rogawski, Colin Adams, Robert FranzosaPublisher:W. H. Freeman
 Calculus: Early Transcendental FunctionsCalculusISBN:9781337552516Author:Ron Larson, Bruce H. EdwardsPublisher:Cengage Learning