Concept explainers
Videos
a.
Use a graphical utility to create a sactter plot of the data.
a.
Answer to Problem 23PS
The

Explanation of Solution
Calculation:
The scatter plot of the data is given as
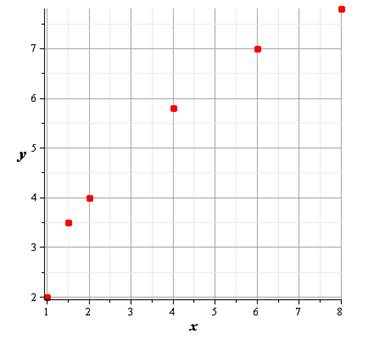
Hence, the graph is shown above.
b.
Decide the model for data .
b.
Answer to Problem 23PS
logarithmic model.
Explanation of Solution
Calculation:
The best model for these points is logarithmic model
Hence, the data could be modelled by a logarithmic model
c.
Explain the model of part
c.
Answer to Problem 23PS
From the graph, we can see that points are increasing non-linearly, so, we cannot use a model linear model for this. We can also see that points are not growing rapidly,so, exponential model is not suitable.
Explanation of Solution
Calculation:
From the graph, we can see that points are increasing non-linearly, so, we cannot use a model linear model for this. We can also see that points are not growing rapidly,so, exponential model is not suitable.
Hence, we chose logarithmic model.
d.
find the model you chose in part (b) for the data and graph the model with scatter plot.
d.
Answer to Problem 23PS
Explanation of Solution
Calculation:
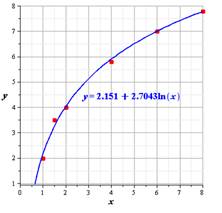
Now, by using the values of and from the data and graphing utility we get,
Hence, the required model is
Now, the graph of scatter plot is,
Hence, the graph is shown above.
e.
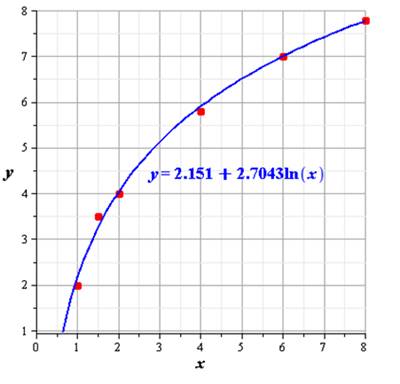
Determine if the model you chose fits the data.
e.
Answer to Problem 23PS
From the graph we can see that the model we get fits the data very well.
Explanation of Solution
Calculation:
From the graph we can see that the model we get fits the data very well.
Hence, logarithmic model fits the data very well.
Chapter 3 Solutions
Precalculus with Limits


- Solve the differential equation. 37 6 dy = 2x³y7 - 4x³ dxarrow_forwardFind an equation of the curve that passes through the point (0, 1) and whose slope at (x, y) is 3xy.arrow_forwardQ6. A fossil piece has been found in Alberta that contains 34% of C14 in it. What is the age of this fossil piece?arrow_forward
- Q5. Briefly explain what are isotopes of an elements, with an example, and why some isotopes are radioactive. 470arrow_forwardQ1. Will you earn more interest amount in two years by depositing $2000 in a simple interest account that pays 6% or in an account that pays 6.15% interest compounded monthly? tarrow_forwardQ4. We want to invest $18000 in an account compounded continuously. How long should the investment be kept so final value of the account reaches $25000 if the annual rate of interest is 5.8%?arrow_forward
- Q3. Determine the effective annual yield for each investment below. Then select the better investment. Assume 365 days in a year. a) 5.6% compounded semiannually; b) 5.4% compounded daily.arrow_forwardQ2. You deposit $22,000 in an account that pays 4.8% interest compounded monthly. a. Find the future value after six years. & b b. Determine the effective annual yield of this account.arrow_forward18. Using the method of variation of parameter, a particular solution to y′′ + 16y = 4 sec(4t) isyp(t) = u1(t) cos(4t) + u2(t) sin(4t). Then u2(t) is equal toA. 1 B. t C. ln | sin 4t| D. ln | cos 4t| E. sec(4t)arrow_forward
 Calculus: Early TranscendentalsCalculusISBN:9781285741550Author:James StewartPublisher:Cengage Learning
 Thomas' Calculus (14th Edition)CalculusISBN:9780134438986Author:Joel R. Hass, Christopher E. Heil, Maurice D. WeirPublisher:PEARSON
 Calculus: Early Transcendentals (3rd Edition)CalculusISBN:9780134763644Author:William L. Briggs, Lyle Cochran, Bernard Gillett, Eric SchulzPublisher:PEARSON
 Calculus: Early TranscendentalsCalculusISBN:9781319050740Author:Jon Rogawski, Colin Adams, Robert FranzosaPublisher:W. H. Freeman
 Calculus: Early Transcendental FunctionsCalculusISBN:9781337552516Author:Ron Larson, Bruce H. EdwardsPublisher:Cengage Learning