
Videos
To graph: the given inequality.
Answer to Problem 8MCQ
Explanation of Solution
Given information:
Calculation:
Make a table of values for line equation
| 0 | 1 | 2 | 3 | 4 | ||||
| 3 | 2 | 3 |
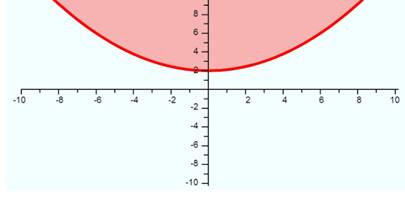
Plot these points for the equations and test the true points to shade the region of inequality. Since the inequality has greater than or equal to sign so, the graph will have solid line.
Check the test point for inequality as follows:
| Test point | True or False | |
| False | ||
| True |
The graph of the given inequality is as follows:

Chapter 3 Solutions
Advanced Mathematical Concepts: Precalculus with Applications, Student Edition
Additional Math Textbook Solutions
Elementary Statistics: Picturing the World (7th Edition)
Pre-Algebra Student Edition
Using and Understanding Mathematics: A Quantitative Reasoning Approach (6th Edition)
Basic Business Statistics, Student Value Edition
University Calculus: Early Transcendentals (4th Edition)


 Calculus: Early TranscendentalsCalculusISBN:9781285741550Author:James StewartPublisher:Cengage Learning
 Thomas' Calculus (14th Edition)CalculusISBN:9780134438986Author:Joel R. Hass, Christopher E. Heil, Maurice D. WeirPublisher:PEARSON
 Calculus: Early Transcendentals (3rd Edition)CalculusISBN:9780134763644Author:William L. Briggs, Lyle Cochran, Bernard Gillett, Eric SchulzPublisher:PEARSON
 Calculus: Early TranscendentalsCalculusISBN:9781319050740Author:Jon Rogawski, Colin Adams, Robert FranzosaPublisher:W. H. Freeman
 Calculus: Early Transcendental FunctionsCalculusISBN:9781337552516Author:Ron Larson, Bruce H. EdwardsPublisher:Cengage Learning