
Introductory Statistics
1st Edition
ISBN: 9781938168208
Author: Barbara Illowsky, Susan Dean
Publisher: OpenStax College
expand_more
expand_more
format_list_bulleted
Concept explainers
Videos
Textbook Question
Chapter 3, Problem 74H
Use the following information to answer the next 12 exercises. The graph shown is based on more than 170,000 interviews done by Gallup that took place from January through December 2012. The sample consists of employed Americans 18 years of age or older. The Emotional Health Index Scores are the
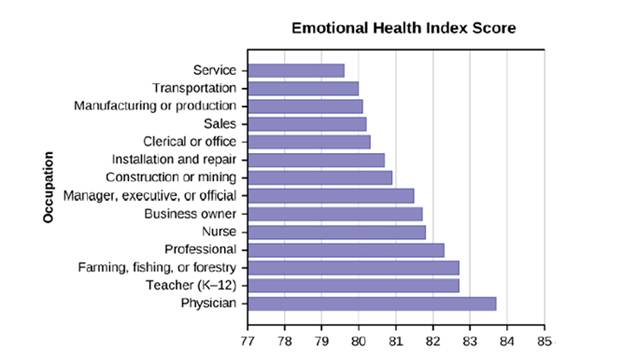
Figure 3.12
What is the
Expert Solution & Answer

Trending nowThis is a popular solution!

Students have asked these similar questions
What is the solution and answer to question?
To: [Boss's Name]
From: Nathaniel D Sain
Date: 4/5/2025
Subject: Decision Analysis for Business Scenario
Introduction to the Business Scenario
Our delivery services business has been experiencing steady growth, leading to an
increased demand for faster and more efficient deliveries. To meet this demand,
we must decide on the best strategy to expand our fleet. The three possible
alternatives under consideration are purchasing new delivery vehicles, leasing
vehicles, or partnering with third-party drivers. The decision must account for
various external factors, including fuel price fluctuations, demand stability, and
competition growth, which we categorize as the states of nature. Each alternative
presents unique advantages and challenges, and our goal is to select the most
viable option using a structured decision-making approach.
Alternatives and States of Nature
The three alternatives for fleet expansion were chosen based on their cost
implications, operational efficiency, and…
Business
Chapter 3 Solutions
Introductory Statistics
Ch. 3 - The sample space S Is all the ordered pairs of two...Ch. 3 - You have a fair. well-shuffled deck of 52 cards....Ch. 3 - You have a fair, well-shuffled deck of 52 cards....Ch. 3 - Draw two cards from a standard 52-card deck with...Ch. 3 - A box has two balls, one white and one red. We...Ch. 3 - Let event A = learning Spanish. Let event B =...Ch. 3 - In a bag, there are six red marbles and four green...Ch. 3 - A student goes to the library. Let events B = the...Ch. 3 - In a basketball arena, • 70% of the fans are...Ch. 3 - Mark Is deciding which route to take to work. His...
Ch. 3 - A box has two balls, one white and one red. We...Ch. 3 - Helen plays basketball. For free throws she makes...Ch. 3 - A school has 200 seniors of whom 140 will be going...Ch. 3 - A student goes to the library. Let events B = the...Ch. 3 - A school has 200 seniors of whom 140 will be going...Ch. 3 - A student goes to the library Let events B = the...Ch. 3 - Table 3.3 shows the number of athletes who stretch...Ch. 3 - Table 3.6 shows a random sample of 200 cyclists...Ch. 3 - Table 3.10 relates the weights and heights of a...Ch. 3 - In a standard deck. there are 52 cards. 12 cards...Ch. 3 - In a standard deck, there are 52 cards. Twelve...Ch. 3 - Suppose there are four red balls and three yellow...Ch. 3 - Suppose an experiment has outcomes black, white,...Ch. 3 - Roll a fair, six-sided die. Let A = a prime number...Ch. 3 - Fifty percent of the workers at a factory work a...Ch. 3 - In a bookstore, the probability that the customer...Ch. 3 - In a particular college class, there are male and...Ch. 3 - Use (he following information to answer the next...Ch. 3 - Use (he following information to answer the next...Ch. 3 - Use (he following information to answer the next...Ch. 3 - Use (he following information to answer the next...Ch. 3 - Use the following information to answer the next...Ch. 3 - Use the following information to answer the next...Ch. 3 - Use the following information to answer the next...Ch. 3 - Use the following information to answer the next...Ch. 3 - Use the following information to answer the next...Ch. 3 - Use the following information to answer the next...Ch. 3 - Use the following information to answer the next...Ch. 3 - Use the following information to answer the next...Ch. 3 - Use the following information to answer the next...Ch. 3 - Use the following in formation to answer the next...Ch. 3 - Use the following in formation to answer the next...Ch. 3 - Use the following information to answer the next...Ch. 3 - What is the probability of drawing a red card in a...Ch. 3 - What is the probability of drawing a club in a...Ch. 3 - What is the probability of rolling an even number...Ch. 3 - What is the probability of rolling a prime number...Ch. 3 - Use the following information to answer the next...Ch. 3 - Use the following information to answer the next...Ch. 3 - Use the following information to answer the next...Ch. 3 - Use the following information to answer the next...Ch. 3 - Use the following information to answer the next...Ch. 3 - Use the following information to answer the next...Ch. 3 - Use the following information to answer the next...Ch. 3 - Use the following information to answer the next...Ch. 3 - Use the following information to answer the next...Ch. 3 - Use the following information to answer the next...Ch. 3 - Use the following information to answer the next...Ch. 3 - Use the following information to answer the next...Ch. 3 - Use the following information to answer the next...Ch. 3 - Use (he following information to answer the next...Ch. 3 - A shelf holds 12 books. Eight are fiction and the...Ch. 3 - What is the sum of the probabilities of an event...Ch. 3 - Use the following information to answer the next...Ch. 3 - Use the following information to answer the next...Ch. 3 - E and F are mutually exclusive events. P(E) = 0.4;...Ch. 3 - J and K are independent events. P(J/ K) = 0.3....Ch. 3 - U and V are mutua11y exclusive events. P( U) =...Ch. 3 - Q and R are independent events. P(Q) = 0.4 and P(Q...Ch. 3 - Use the following information to answer the next...Ch. 3 - Use the following information to answer the next...Ch. 3 - Use the following information to answer the next...Ch. 3 - Use the following information to answer the next...Ch. 3 - Use the following information to answer the next...Ch. 3 - Use the following information to answer the next...Ch. 3 - Use the following information to answer the next...Ch. 3 - Use the following information to answer the next...Ch. 3 - Use the following information to answer the next...Ch. 3 - Use the following information to answer the next...Ch. 3 - Use the following information to answer the next...Ch. 3 - Use the following information to answer the next...Ch. 3 - Use the following information to answer the next...Ch. 3 - Use the following information to answer the next...Ch. 3 - Use the following information to answer the next...Ch. 3 - Complete the table using the data provided....Ch. 3 - Suppose that one person from the study Is randomly...Ch. 3 - Find the probability that the person was Latino.Ch. 3 - In words, explain what it means to pick one person...Ch. 3 - In words, explain what it means to pick one person...Ch. 3 - In words, explain what it means to pick one person...Ch. 3 - Prove that smoking level day and ethnicity are...Ch. 3 - Figure 3.11 The graph in Figure 3.11 displays the...Ch. 3 - Explain what is wrong with the following...Ch. 3 - Use the following information to answer the next...Ch. 3 - Use the following information to answer the next...Ch. 3 - Use the following information to answer the next...Ch. 3 - Use the following information to answer the next...Ch. 3 - Use the following information to answer the next...Ch. 3 - Use the following information to answer the next...Ch. 3 - Use the following information to answer the next...Ch. 3 - Use the following information to answer the next...Ch. 3 - Use the following information to answer the next...Ch. 3 - Use the following information to answer the next...Ch. 3 - Use the following information to answer the next...Ch. 3 - Use the following information to answer the next...Ch. 3 - On February 28, 2013, a Field Poll Survey reported...Ch. 3 - After Rob Ford, the mayor of Toronto, announced...Ch. 3 - Use the following information o answer the next...Ch. 3 - Use the following information o answer the next...Ch. 3 - Use the following information o answer the next...Ch. 3 - Suppose that you have eight cards. Five are green...Ch. 3 - Roll two fair dice separately. Each die has six...Ch. 3 - A special deck of cards has ten cards. Four are...Ch. 3 - An experiment consists of first rolling a die and...Ch. 3 - An experiment consists of tossing a nickel, a...Ch. 3 - Consider the following scenario: Let P(C) = 0.4....Ch. 3 - Y and Z are independent events. a. Rewrite the...Ch. 3 - G and H are mutually exclusive events. P(G) = 0.5...Ch. 3 - Approximately 281,000,000 people over age five...Ch. 3 - , the U.S. government held a lottery to issue...Ch. 3 - Three professors at George Washington University...Ch. 3 - The following table of data obtained from...Ch. 3 - United Blood Services Is a blood bank that serves...Ch. 3 - At a college. 72°o of courses have final exams and...Ch. 3 - In a box of assorted cookies, 36% contain...Ch. 3 - A college finds that 10% of students have taken a...Ch. 3 - Use the information in the Table 3.19 to answer...Ch. 3 - Use the information in the Table 3.19 to answer...Ch. 3 - Use the information in the Table 3.19 to answer...Ch. 3 - Use the information in the Table 3.19 to answer...Ch. 3 - Use the information in the Table 3.19 to answer...Ch. 3 - Use the information in the Table 3.19 to answer...Ch. 3 - Use the information in the Table 3.19 to answer...Ch. 3 - Use the information in the Table 3.19 to answer...Ch. 3 - Table 3.20 gives the number of suicides estimated...Ch. 3 - Use the following information to answer the next...Ch. 3 - Use the following information to answer the next...Ch. 3 - Table 3.22 identifies a group of children by one...Ch. 3 - In a previous year, the weights of the members of...Ch. 3 - Use the following information to answer the next...Ch. 3 - Use the following information to answer the next...Ch. 3 - A box of cookies contains three chocolate and...Ch. 3 - A previous year, the weights of the members of the...Ch. 3 - The probability that a male develops some form of...Ch. 3 - Given events G and H: P(G) = 0.43; P(H) = 0.26;...Ch. 3 - Given events land K: P(J = 0.18; P(K = 0.37: P(J...Ch. 3 - Use the following information to answer the next...Ch. 3 - Use the following information to answer the next...Ch. 3 - Use the following information to answer the next...Ch. 3 - Use the following information to answer the next...Ch. 3 - Approximately 86.5% of Americans commute to work...Ch. 3 - When the Euro coin was introduced in 2002, two...Ch. 3 - Use the following information o answer the next...Ch. 3 - Answer these questions using probability rules. Do...
Additional Math Textbook Solutions
Find more solutions based on key concepts
Student Ages The mean age of all 2550 students at a small college is 22.8 years with a standard deviation is 3....
Introductory Statistics
Find all the second-order partial derivatives of the functions in Exercises 41–50.
48.
University Calculus: Early Transcendentals (4th Edition)
CHECK POINT 1 Write a word description of the set L = {a, b, c, d, e, f}.
Thinking Mathematically (6th Edition)
Genetics. In Exercises 15–20, refer to the accompanying table, which describes results from groups of 8 births ...
Elementary Statistics (13th Edition)
A student has to sell 2 books from a collection of 6 math, 7 science, and 4 economics books. How many choices a...
A First Course in Probability (10th Edition)
Knowledge Booster


Learn more about
Need a deep-dive on the concept behind this application? Look no further. Learn more about this topic, statistics and related others by exploring similar questions and additional content below.Similar questions
- Why researchers are interested in describing measures of the center and measures of variation of a data set?arrow_forwardWHAT IS THE SOLUTION?arrow_forwardThe following ordered data list shows the data speeds for cell phones used by a telephone company at an airport: A. Calculate the Measures of Central Tendency from the ungrouped data list. B. Group the data in an appropriate frequency table. C. Calculate the Measures of Central Tendency using the table in point B. 0.8 1.4 1.8 1.9 3.2 3.6 4.5 4.5 4.6 6.2 6.5 7.7 7.9 9.9 10.2 10.3 10.9 11.1 11.1 11.6 11.8 12.0 13.1 13.5 13.7 14.1 14.2 14.7 15.0 15.1 15.5 15.8 16.0 17.5 18.2 20.2 21.1 21.5 22.2 22.4 23.1 24.5 25.7 28.5 34.6 38.5 43.0 55.6 71.3 77.8arrow_forward
- II Consider the following data matrix X: X1 X2 0.5 0.4 0.2 0.5 0.5 0.5 10.3 10 10.1 10.4 10.1 10.5 What will the resulting clusters be when using the k-Means method with k = 2. In your own words, explain why this result is indeed expected, i.e. why this clustering minimises the ESS map.arrow_forwardwhy the answer is 3 and 10?arrow_forwardPS 9 Two films are shown on screen A and screen B at a cinema each evening. The numbers of people viewing the films on 12 consecutive evenings are shown in the back-to-back stem-and-leaf diagram. Screen A (12) Screen B (12) 8 037 34 7 6 4 0 534 74 1645678 92 71689 Key: 116|4 represents 61 viewers for A and 64 viewers for B A second stem-and-leaf diagram (with rows of the same width as the previous diagram) is drawn showing the total number of people viewing films at the cinema on each of these 12 evenings. Find the least and greatest possible number of rows that this second diagram could have. TIP On the evening when 30 people viewed films on screen A, there could have been as few as 37 or as many as 79 people viewing films on screen B.arrow_forward
- Q.2.4 There are twelve (12) teams participating in a pub quiz. What is the probability of correctly predicting the top three teams at the end of the competition, in the correct order? Give your final answer as a fraction in its simplest form.arrow_forwardThe table below indicates the number of years of experience of a sample of employees who work on a particular production line and the corresponding number of units of a good that each employee produced last month. Years of Experience (x) Number of Goods (y) 11 63 5 57 1 48 4 54 5 45 3 51 Q.1.1 By completing the table below and then applying the relevant formulae, determine the line of best fit for this bivariate data set. Do NOT change the units for the variables. X y X2 xy Ex= Ey= EX2 EXY= Q.1.2 Estimate the number of units of the good that would have been produced last month by an employee with 8 years of experience. Q.1.3 Using your calculator, determine the coefficient of correlation for the data set. Interpret your answer. Q.1.4 Compute the coefficient of determination for the data set. Interpret your answer.arrow_forwardCan you answer this question for mearrow_forward
- Techniques QUAT6221 2025 PT B... TM Tabudi Maphoru Activities Assessments Class Progress lIE Library • Help v The table below shows the prices (R) and quantities (kg) of rice, meat and potatoes items bought during 2013 and 2014: 2013 2014 P1Qo PoQo Q1Po P1Q1 Price Ро Quantity Qo Price P1 Quantity Q1 Rice 7 80 6 70 480 560 490 420 Meat 30 50 35 60 1 750 1 500 1 800 2 100 Potatoes 3 100 3 100 300 300 300 300 TOTAL 40 230 44 230 2 530 2 360 2 590 2 820 Instructions: 1 Corall dawn to tha bottom of thir ceraan urina se se tha haca nariad in archerca antarand cubmit Q Search ENG US 口X 2025/05arrow_forwardThe table below indicates the number of years of experience of a sample of employees who work on a particular production line and the corresponding number of units of a good that each employee produced last month. Years of Experience (x) Number of Goods (y) 11 63 5 57 1 48 4 54 45 3 51 Q.1.1 By completing the table below and then applying the relevant formulae, determine the line of best fit for this bivariate data set. Do NOT change the units for the variables. X y X2 xy Ex= Ey= EX2 EXY= Q.1.2 Estimate the number of units of the good that would have been produced last month by an employee with 8 years of experience. Q.1.3 Using your calculator, determine the coefficient of correlation for the data set. Interpret your answer. Q.1.4 Compute the coefficient of determination for the data set. Interpret your answer.arrow_forwardQ.3.2 A sample of consumers was asked to name their favourite fruit. The results regarding the popularity of the different fruits are given in the following table. Type of Fruit Number of Consumers Banana 25 Apple 20 Orange 5 TOTAL 50 Draw a bar chart to graphically illustrate the results given in the table.arrow_forward
arrow_back_ios
SEE MORE QUESTIONS
arrow_forward_ios
Recommended textbooks for you
 Holt Mcdougal Larson Pre-algebra: Student Edition...AlgebraISBN:9780547587776Author:HOLT MCDOUGALPublisher:HOLT MCDOUGAL
 Glencoe Algebra 1, Student Edition, 9780079039897...AlgebraISBN:9780079039897Author:CarterPublisher:McGraw Hill
 Big Ideas Math A Bridge To Success Algebra 1: Stu...AlgebraISBN:9781680331141Author:HOUGHTON MIFFLIN HARCOURTPublisher:Houghton Mifflin Harcourt
 College Algebra (MindTap Course List)AlgebraISBN:9781305652231Author:R. David Gustafson, Jeff HughesPublisher:Cengage Learning
Holt Mcdougal Larson Pre-algebra: Student Edition...
Algebra
ISBN:9780547587776
Author:HOLT MCDOUGAL
Publisher:HOLT MCDOUGAL
Glencoe Algebra 1, Student Edition, 9780079039897...
Algebra
ISBN:9780079039897
Author:Carter
Publisher:McGraw Hill
Big Ideas Math A Bridge To Success Algebra 1: Stu...
Algebra
ISBN:9781680331141
Author:HOUGHTON MIFFLIN HARCOURT
Publisher:Houghton Mifflin Harcourt
College Algebra (MindTap Course List)
Algebra
ISBN:9781305652231
Author:R. David Gustafson, Jeff Hughes
Publisher:Cengage Learning
Statistics 4.1 Point Estimators; Author: Dr. Jack L. Jackson II;https://www.youtube.com/watch?v=2MrI0J8XCEE;License: Standard YouTube License, CC-BY
Statistics 101: Point Estimators; Author: Brandon Foltz;https://www.youtube.com/watch?v=4v41z3HwLaM;License: Standard YouTube License, CC-BY
Central limit theorem; Author: 365 Data Science;https://www.youtube.com/watch?v=b5xQmk9veZ4;License: Standard YouTube License, CC-BY
Point Estimate Definition & Example; Author: Prof. Essa;https://www.youtube.com/watch?v=OTVwtvQmSn0;License: Standard Youtube License
Point Estimation; Author: Vamsidhar Ambatipudi;https://www.youtube.com/watch?v=flqhlM2bZWc;License: Standard Youtube License