
Introductory Statistics
1st Edition
ISBN: 9781938168208
Author: Barbara Illowsky, Susan Dean
Publisher: OpenStax College
expand_more
expand_more
format_list_bulleted
Concept explainers
Videos
Textbook Question
Chapter 3, Problem 71H
Use the following information to answer the next 12 exercises. The graph shown is based on more than 170,000 interviews done by Gallup that took place from January through December 2012. The sample consists of employed Americans 18 years of age or older. The Emotional Health Index Scores are the
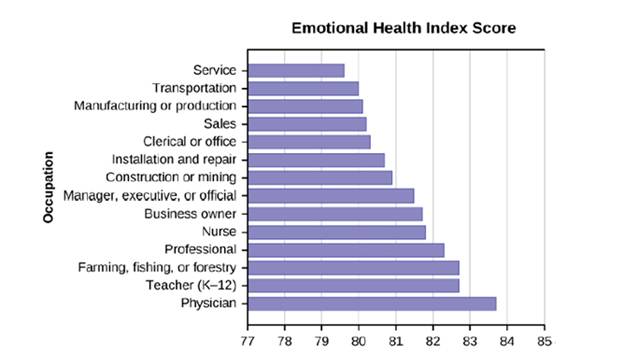
Figure 3.12
Find the
Expert Solution & Answer

Trending nowThis is a popular solution!

Students have asked these similar questions
Carpetland salespersons average $8,000 per week in sales. Steve Contois, the firm's vice president, proposes a compensation plan with new selling incentives. Steve hopes that the results of a trial selling period will enable him to conclude that the compensation plan increases the average sales per salesperson.
a. Develop the appropriate null and alternative hypotheses.H 0: H a:
توليد تمرين شامل حول الانحدار الخطي المتعدد بطريقة المربعات الصغرى
The U.S. Postal Service will ship a Priority Mail® Large Flat Rate Box (12" 3 12" 3 5½") any
where in the United States for a fixed price, regardless of weight. The weights (ounces) of 20 ran
domly chosen boxes are shown below. (a) Make a stem-and-leaf diagram. (b) Make a histogram.
(c) Describe the shape of the distribution. Weights
72 86 28 67 64 65 45 86 31 32
39 92 90 91 84 62 80 74 63 86
Chapter 3 Solutions
Introductory Statistics
Ch. 3 - The sample space S Is all the ordered pairs of two...Ch. 3 - You have a fair. well-shuffled deck of 52 cards....Ch. 3 - You have a fair, well-shuffled deck of 52 cards....Ch. 3 - Draw two cards from a standard 52-card deck with...Ch. 3 - A box has two balls, one white and one red. We...Ch. 3 - Let event A = learning Spanish. Let event B =...Ch. 3 - In a bag, there are six red marbles and four green...Ch. 3 - A student goes to the library. Let events B = the...Ch. 3 - In a basketball arena, • 70% of the fans are...Ch. 3 - Mark Is deciding which route to take to work. His...
Ch. 3 - A box has two balls, one white and one red. We...Ch. 3 - Helen plays basketball. For free throws she makes...Ch. 3 - A school has 200 seniors of whom 140 will be going...Ch. 3 - A student goes to the library. Let events B = the...Ch. 3 - A school has 200 seniors of whom 140 will be going...Ch. 3 - A student goes to the library Let events B = the...Ch. 3 - Table 3.3 shows the number of athletes who stretch...Ch. 3 - Table 3.6 shows a random sample of 200 cyclists...Ch. 3 - Table 3.10 relates the weights and heights of a...Ch. 3 - In a standard deck. there are 52 cards. 12 cards...Ch. 3 - In a standard deck, there are 52 cards. Twelve...Ch. 3 - Suppose there are four red balls and three yellow...Ch. 3 - Suppose an experiment has outcomes black, white,...Ch. 3 - Roll a fair, six-sided die. Let A = a prime number...Ch. 3 - Fifty percent of the workers at a factory work a...Ch. 3 - In a bookstore, the probability that the customer...Ch. 3 - In a particular college class, there are male and...Ch. 3 - Use (he following information to answer the next...Ch. 3 - Use (he following information to answer the next...Ch. 3 - Use (he following information to answer the next...Ch. 3 - Use (he following information to answer the next...Ch. 3 - Use the following information to answer the next...Ch. 3 - Use the following information to answer the next...Ch. 3 - Use the following information to answer the next...Ch. 3 - Use the following information to answer the next...Ch. 3 - Use the following information to answer the next...Ch. 3 - Use the following information to answer the next...Ch. 3 - Use the following information to answer the next...Ch. 3 - Use the following information to answer the next...Ch. 3 - Use the following information to answer the next...Ch. 3 - Use the following in formation to answer the next...Ch. 3 - Use the following in formation to answer the next...Ch. 3 - Use the following information to answer the next...Ch. 3 - What is the probability of drawing a red card in a...Ch. 3 - What is the probability of drawing a club in a...Ch. 3 - What is the probability of rolling an even number...Ch. 3 - What is the probability of rolling a prime number...Ch. 3 - Use the following information to answer the next...Ch. 3 - Use the following information to answer the next...Ch. 3 - Use the following information to answer the next...Ch. 3 - Use the following information to answer the next...Ch. 3 - Use the following information to answer the next...Ch. 3 - Use the following information to answer the next...Ch. 3 - Use the following information to answer the next...Ch. 3 - Use the following information to answer the next...Ch. 3 - Use the following information to answer the next...Ch. 3 - Use the following information to answer the next...Ch. 3 - Use the following information to answer the next...Ch. 3 - Use the following information to answer the next...Ch. 3 - Use the following information to answer the next...Ch. 3 - Use (he following information to answer the next...Ch. 3 - A shelf holds 12 books. Eight are fiction and the...Ch. 3 - What is the sum of the probabilities of an event...Ch. 3 - Use the following information to answer the next...Ch. 3 - Use the following information to answer the next...Ch. 3 - E and F are mutually exclusive events. P(E) = 0.4;...Ch. 3 - J and K are independent events. P(J/ K) = 0.3....Ch. 3 - U and V are mutua11y exclusive events. P( U) =...Ch. 3 - Q and R are independent events. P(Q) = 0.4 and P(Q...Ch. 3 - Use the following information to answer the next...Ch. 3 - Use the following information to answer the next...Ch. 3 - Use the following information to answer the next...Ch. 3 - Use the following information to answer the next...Ch. 3 - Use the following information to answer the next...Ch. 3 - Use the following information to answer the next...Ch. 3 - Use the following information to answer the next...Ch. 3 - Use the following information to answer the next...Ch. 3 - Use the following information to answer the next...Ch. 3 - Use the following information to answer the next...Ch. 3 - Use the following information to answer the next...Ch. 3 - Use the following information to answer the next...Ch. 3 - Use the following information to answer the next...Ch. 3 - Use the following information to answer the next...Ch. 3 - Use the following information to answer the next...Ch. 3 - Complete the table using the data provided....Ch. 3 - Suppose that one person from the study Is randomly...Ch. 3 - Find the probability that the person was Latino.Ch. 3 - In words, explain what it means to pick one person...Ch. 3 - In words, explain what it means to pick one person...Ch. 3 - In words, explain what it means to pick one person...Ch. 3 - Prove that smoking level day and ethnicity are...Ch. 3 - Figure 3.11 The graph in Figure 3.11 displays the...Ch. 3 - Explain what is wrong with the following...Ch. 3 - Use the following information to answer the next...Ch. 3 - Use the following information to answer the next...Ch. 3 - Use the following information to answer the next...Ch. 3 - Use the following information to answer the next...Ch. 3 - Use the following information to answer the next...Ch. 3 - Use the following information to answer the next...Ch. 3 - Use the following information to answer the next...Ch. 3 - Use the following information to answer the next...Ch. 3 - Use the following information to answer the next...Ch. 3 - Use the following information to answer the next...Ch. 3 - Use the following information to answer the next...Ch. 3 - Use the following information to answer the next...Ch. 3 - On February 28, 2013, a Field Poll Survey reported...Ch. 3 - After Rob Ford, the mayor of Toronto, announced...Ch. 3 - Use the following information o answer the next...Ch. 3 - Use the following information o answer the next...Ch. 3 - Use the following information o answer the next...Ch. 3 - Suppose that you have eight cards. Five are green...Ch. 3 - Roll two fair dice separately. Each die has six...Ch. 3 - A special deck of cards has ten cards. Four are...Ch. 3 - An experiment consists of first rolling a die and...Ch. 3 - An experiment consists of tossing a nickel, a...Ch. 3 - Consider the following scenario: Let P(C) = 0.4....Ch. 3 - Y and Z are independent events. a. Rewrite the...Ch. 3 - G and H are mutually exclusive events. P(G) = 0.5...Ch. 3 - Approximately 281,000,000 people over age five...Ch. 3 - , the U.S. government held a lottery to issue...Ch. 3 - Three professors at George Washington University...Ch. 3 - The following table of data obtained from...Ch. 3 - United Blood Services Is a blood bank that serves...Ch. 3 - At a college. 72°o of courses have final exams and...Ch. 3 - In a box of assorted cookies, 36% contain...Ch. 3 - A college finds that 10% of students have taken a...Ch. 3 - Use the information in the Table 3.19 to answer...Ch. 3 - Use the information in the Table 3.19 to answer...Ch. 3 - Use the information in the Table 3.19 to answer...Ch. 3 - Use the information in the Table 3.19 to answer...Ch. 3 - Use the information in the Table 3.19 to answer...Ch. 3 - Use the information in the Table 3.19 to answer...Ch. 3 - Use the information in the Table 3.19 to answer...Ch. 3 - Use the information in the Table 3.19 to answer...Ch. 3 - Table 3.20 gives the number of suicides estimated...Ch. 3 - Use the following information to answer the next...Ch. 3 - Use the following information to answer the next...Ch. 3 - Table 3.22 identifies a group of children by one...Ch. 3 - In a previous year, the weights of the members of...Ch. 3 - Use the following information to answer the next...Ch. 3 - Use the following information to answer the next...Ch. 3 - A box of cookies contains three chocolate and...Ch. 3 - A previous year, the weights of the members of the...Ch. 3 - The probability that a male develops some form of...Ch. 3 - Given events G and H: P(G) = 0.43; P(H) = 0.26;...Ch. 3 - Given events land K: P(J = 0.18; P(K = 0.37: P(J...Ch. 3 - Use the following information to answer the next...Ch. 3 - Use the following information to answer the next...Ch. 3 - Use the following information to answer the next...Ch. 3 - Use the following information to answer the next...Ch. 3 - Approximately 86.5% of Americans commute to work...Ch. 3 - When the Euro coin was introduced in 2002, two...Ch. 3 - Use the following information o answer the next...Ch. 3 - Answer these questions using probability rules. Do...
Additional Math Textbook Solutions
Find more solutions based on key concepts
Evaluating limits Evaluate the following limits. 31. limx35x4x3
Calculus: Early Transcendentals (2nd Edition)
29-36. Total and Annual Returns. Compute the total and annual returns on the following investments.
29. Five ye...
Using and Understanding Mathematics: A Quantitative Reasoning Approach (6th Edition)
Find the volumes of the regions in Exercises 23–36.
27. The tetrahedron in the first octant bounded by the coor...
University Calculus: Early Transcendentals (4th Edition)
Two fair dice are rolled. What is the conditional probability that at least one lands on 6 given that the dice ...
A First Course in Probability (10th Edition)
Knowledge Booster


Learn more about
Need a deep-dive on the concept behind this application? Look no further. Learn more about this topic, statistics and related others by exploring similar questions and additional content below.Similar questions
- (a) What is a bimodal histogram? (b) Explain the difference between left-skewed, symmetric, and right-skewed histograms. (c) What is an outlierarrow_forward(a) Test the hypothesis. Consider the hypothesis test Ho = : against H₁o < 02. Suppose that the sample sizes aren₁ = 7 and n₂ = 13 and that $² = 22.4 and $22 = 28.2. Use α = 0.05. Ho is not ✓ rejected. 9-9 IV (b) Find a 95% confidence interval on of 102. Round your answer to two decimal places (e.g. 98.76).arrow_forwardLet us suppose we have some article reported on a study of potential sources of injury to equine veterinarians conducted at a university veterinary hospital. Forces on the hand were measured for several common activities that veterinarians engage in when examining or treating horses. We will consider the forces on the hands for two tasks, lifting and using ultrasound. Assume that both sample sizes are 6, the sample mean force for lifting was 6.2 pounds with standard deviation 1.5 pounds, and the sample mean force for using ultrasound was 6.4 pounds with standard deviation 0.3 pounds. Assume that the standard deviations are known. Suppose that you wanted to detect a true difference in mean force of 0.25 pounds on the hands for these two activities. Under the null hypothesis, 40 = 0. What level of type II error would you recommend here? Round your answer to four decimal places (e.g. 98.7654). Use a = 0.05. β = i What sample size would be required? Assume the sample sizes are to be equal.…arrow_forward
- = Consider the hypothesis test Ho: μ₁ = μ₂ against H₁ μ₁ μ2. Suppose that sample sizes are n₁ = 15 and n₂ = 15, that x1 = 4.7 and X2 = 7.8 and that s² = 4 and s² = 6.26. Assume that o and that the data are drawn from normal distributions. Use απ 0.05. (a) Test the hypothesis and find the P-value. (b) What is the power of the test in part (a) for a true difference in means of 3? (c) Assuming equal sample sizes, what sample size should be used to obtain ẞ = 0.05 if the true difference in means is - 2? Assume that α = 0.05. (a) The null hypothesis is 98.7654). rejected. The P-value is 0.0008 (b) The power is 0.94 . Round your answer to four decimal places (e.g. Round your answer to two decimal places (e.g. 98.76). (c) n₁ = n2 = 1 . Round your answer to the nearest integer.arrow_forwardConsider the hypothesis test Ho: = 622 against H₁: 6 > 62. Suppose that the sample sizes are n₁ = 20 and n₂ = 8, and that = 4.5; s=2.3. Use a = 0.01. (a) Test the hypothesis. Round your answers to two decimal places (e.g. 98.76). The test statistic is fo = i The critical value is f = Conclusion: i the null hypothesis at a = 0.01. (b) Construct the confidence interval on 02/022 which can be used to test the hypothesis: (Round your answer to two decimal places (e.g. 98.76).) iarrow_forward2011 listing by carmax of the ages and prices of various corollas in a ceratin regionarrow_forward
- س 11/ أ . اذا كانت 1 + x) = 2 x 3 + 2 x 2 + x) هي متعددة حدود محسوبة باستخدام طريقة الفروقات المنتهية (finite differences) من جدول البيانات التالي للدالة (f(x . احسب قيمة . ( 2 درجة ) xi k=0 k=1 k=2 k=3 0 3 1 2 2 2 3 αarrow_forward1. Differentiate between discrete and continuous random variables, providing examples for each type. 2. Consider a discrete random variable representing the number of patients visiting a clinic each day. The probabilities for the number of visits are as follows: 0 visits: P(0) = 0.2 1 visit: P(1) = 0.3 2 visits: P(2) = 0.5 Using this information, calculate the expected value (mean) of the number of patient visits per day. Show all your workings clearly. Rubric to follow Definition of Random variables ( clearly and accurately differentiate between discrete and continuous random variables with appropriate examples for each) Identification of discrete random variable (correctly identifies "number of patient visits" as a discrete random variable and explains reasoning clearly.) Calculation of probabilities (uses the probabilities correctly in the calculation, showing all steps clearly and logically) Expected value calculation (calculate the expected value (mean)…arrow_forwardif the b coloumn of a z table disappeared what would be used to determine b column probabilitiesarrow_forward
- Construct a model of population flow between metropolitan and nonmetropolitan areas of a given country, given that their respective populations in 2015 were 263 million and 45 million. The probabilities are given by the following matrix. (from) (to) metro nonmetro 0.99 0.02 metro 0.01 0.98 nonmetro Predict the population distributions of metropolitan and nonmetropolitan areas for the years 2016 through 2020 (in millions, to four decimal places). (Let x, through x5 represent the years 2016 through 2020, respectively.) x₁ = x2 X3 261.27 46.73 11 259.59 48.41 11 257.96 50.04 11 256.39 51.61 11 tarrow_forwardIf the average price of a new one family home is $246,300 with a standard deviation of $15,000 find the minimum and maximum prices of the houses that a contractor will build to satisfy 88% of the market valuearrow_forward21. ANALYSIS OF LAST DIGITS Heights of statistics students were obtained by the author as part of an experiment conducted for class. The last digits of those heights are listed below. Construct a frequency distribution with 10 classes. Based on the distribution, do the heights appear to be reported or actually measured? Does there appear to be a gap in the frequencies and, if so, how might that gap be explained? What do you know about the accuracy of the results? 3 4 555 0 0 0 0 0 0 0 0 0 1 1 23 3 5 5 5 5 5 5 5 5 5 5 5 5 6 6 8 8 8 9arrow_forward
arrow_back_ios
SEE MORE QUESTIONS
arrow_forward_ios
Recommended textbooks for you
 Holt Mcdougal Larson Pre-algebra: Student Edition...AlgebraISBN:9780547587776Author:HOLT MCDOUGALPublisher:HOLT MCDOUGAL
 Glencoe Algebra 1, Student Edition, 9780079039897...AlgebraISBN:9780079039897Author:CarterPublisher:McGraw Hill
 Big Ideas Math A Bridge To Success Algebra 1: Stu...AlgebraISBN:9781680331141Author:HOUGHTON MIFFLIN HARCOURTPublisher:Houghton Mifflin Harcourt
 College Algebra (MindTap Course List)AlgebraISBN:9781305652231Author:R. David Gustafson, Jeff HughesPublisher:Cengage Learning
Holt Mcdougal Larson Pre-algebra: Student Edition...
Algebra
ISBN:9780547587776
Author:HOLT MCDOUGAL
Publisher:HOLT MCDOUGAL
Glencoe Algebra 1, Student Edition, 9780079039897...
Algebra
ISBN:9780079039897
Author:Carter
Publisher:McGraw Hill
Big Ideas Math A Bridge To Success Algebra 1: Stu...
Algebra
ISBN:9781680331141
Author:HOUGHTON MIFFLIN HARCOURT
Publisher:Houghton Mifflin Harcourt
College Algebra (MindTap Course List)
Algebra
ISBN:9781305652231
Author:R. David Gustafson, Jeff Hughes
Publisher:Cengage Learning
Statistics 4.1 Point Estimators; Author: Dr. Jack L. Jackson II;https://www.youtube.com/watch?v=2MrI0J8XCEE;License: Standard YouTube License, CC-BY
Statistics 101: Point Estimators; Author: Brandon Foltz;https://www.youtube.com/watch?v=4v41z3HwLaM;License: Standard YouTube License, CC-BY
Central limit theorem; Author: 365 Data Science;https://www.youtube.com/watch?v=b5xQmk9veZ4;License: Standard YouTube License, CC-BY
Point Estimate Definition & Example; Author: Prof. Essa;https://www.youtube.com/watch?v=OTVwtvQmSn0;License: Standard Youtube License
Point Estimation; Author: Vamsidhar Ambatipudi;https://www.youtube.com/watch?v=flqhlM2bZWc;License: Standard Youtube License