
Concept explainers
Videos
a.
Find the
a.
Answer to Problem 68SE
The median household income for 2013 is $52,100.
Explanation of Solution
Calculation:
The data represent the sample of 14 household incomes for 2013. It is also known that the median annual household income for 2007 was $55,500.
The variable “household income” is stored in the column “C1” in the MINITAB worksheet.
Median:
Software Procedure:
Step-by-step procedure to obtain the median using MINITAB software:
- Choose Stat > Basic Statistics > Display
Descriptive Statistics . - In Variables enter the columns C1.
- In Statistics select median.
- Click OK.
The output obtained using MINITAB software is given below:
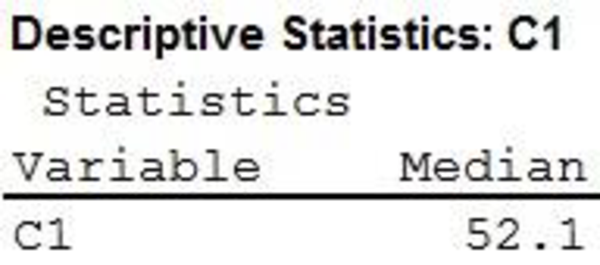
Thus, the median household income for 2013 is $52,100.
b.
Find the percentage change in the median household income from 2007 to 2013.
b.
Answer to Problem 68SE
The percentage change in the median household income from 2007 to 2013 is –6.1%.
Explanation of Solution
Calculation:
The median household income in 2007 is $55,500 (55.5). From Part (a), it can be seen that the median household income in 2013 is $52,100.
The percentage change in the median household income from 2007 to 2013 can be obtained as follows:
Thus, the percentage change in the median household income from 2007 to 2013 is –6.1%.
Therefore, there is 6.1% decrease in the median household income from 2007 to 2013.
c.
Find the first and third
c.
Answer to Problem 68SE
The first and third quartiles are $50,750 and $52,600, respectively.
Explanation of Solution
Calculation:
First quartile and Third quartile:
Software Procedure:
Step-by-step procedure to obtain the first and third quartiles using MINITAB software:
- Choose Stat > Basic Statistics >Display Descriptive Statistics.
- Click OK.
- In Variables, enter the column of C1.
- In Statistics select First quartile and Third quartile.
- Click OK.
The output obtained using MINITAB software is given below:
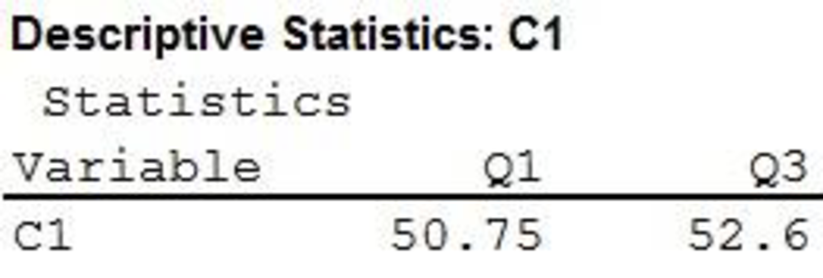
Therefore, the first and third quartiles are $50,750 and $52,600, respectively.
d.
Find the
d.
Answer to Problem 68SE
The five-number summary is as follows:
- Minimum: $46,500,
- First quartile: $50,750,
- Median: $52,100,
- Third quartile: $52,600,
- Maximum: $64,500.
Explanation of Solution
Calculation:
Five-number summary: Minimum, Q1, median, Q3, and maximum.
Five-number summary:
Software Procedure:
Step-by-step procedure to obtain the five-number summary using MINITAB software:
- Choose Stat > Basic Statistics >Display Descriptive Statistics.
- Click OK.
- In Variables, enter the column of C1.
- In Statistics, select Minimum, First quartile, Median, Third quartile and Maximum.
- Click OK.
The output obtained using MINITAB software is given below:
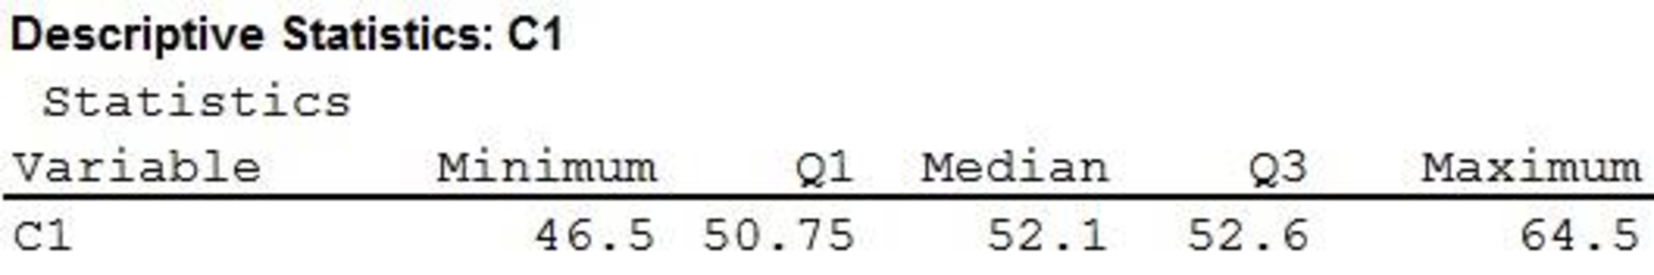
Thus, the five-number summary for data has been obtained.
e.
Identify the outliers using the z-score approach.
Check whether the approach that uses the values of the first and third quartiles and the
e.
Answer to Problem 68SE
The outlier obtained using the z-score approach is $64,500.
No, the approach that uses the values of the first and third quartiles and the interquartile
Explanation of Solution
Calculation:
The z-score:
where
Mean and Standard deviation:
Software Procedure:
Step-by-step procedure to obtain the mean and standard deviation using MINITAB software:
- Choose Stat > Basic Statistics > Display Descriptive Statistics.
- Click OK.
- In Variables, enter the column of C1.
- In Statistics select Mean and Standard deviation.
- Click OK.
The output obtained using MINITAB software is given below:
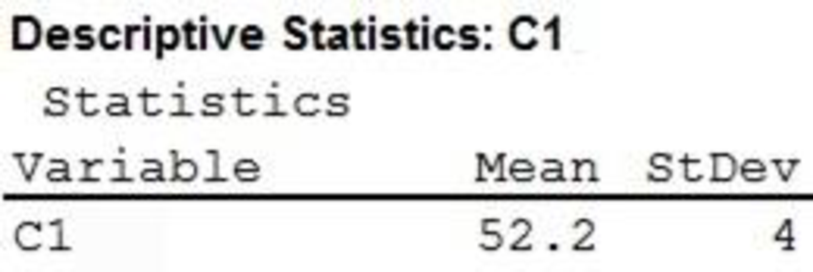
From the MINITAB output, it is clear that the mean and standard deviation are 52.2 and 4, respectively.
The z-score corresponding to 49.4 can be obtained as follows:
Substitute
Thus, the z-score corresponding to 49.4 is –0.70.
Similarly, the z-scores corresponding to other values can be obtained as follows:
| Values | z-score |
| 46.5 | –1.42 |
| 48.7 | –0.87 |
| 49.4 | –0.70 |
| 51.2 | –0.25 |
| 51.3 | –0.22 |
| 51.6 | –0.15 |
| 52.1 | –0.02 |
| 52.1 | –0.02 |
| 52.2 | 0.00 |
| 52.4 | 0.05 |
| 52.5 | 0.07 |
| 52.9 | 0.17 |
| 53.4 | 0.30 |
| 64.5 | 3.07 |
Outlier detection using the 3 standard deviation distance criterion:
An observation is considered as a potential outlier if the absolute value of the z-score of the observation is greater than 3, that is, if the observation lies more than 3 standard deviations away (above or below) from the mean value.
From the table, it can be seen that the z-score corresponding to 64.5 is greater than 3. Thus, the observation of 64.5 is considered to be an outlier.
Interquartile range (IQR):
- The outliers in the data set can be obtained as shown below:
By substituting the corresponding values, we obtain the following results:
A value in the dataset is said to be an outlier if it falls outside the interval from 47.98 to 55.375. In general, the data values less than 47.98 or greater than 55.375 are considered as the outliers.
The first observation (46.5) is less than 47.98, and the observation (64.5) is greater than 55.375. Hence, there are two outliers, $49,400 and $64,500.
Thus, the results obtained in two approaches are not the same.
Want to see more full solutions like this?
Chapter 3 Solutions
MindTap Business Statistics, 1 term (6 months) Printed Access Card for Anderson/Sweeney/Williams/Camm/Cochran's Essentials of Statistics for Business and Economics, 8th


- Question 2: When John started his first job, his first end-of-year salary was $82,500. In the following years, he received salary raises as shown in the following table. Fill the Table: Fill the following table showing his end-of-year salary for each year. I have already provided the end-of-year salaries for the first three years. Calculate the end-of-year salaries for the remaining years using Excel. (If you Excel answer for the top 3 cells is not the same as the one in the following table, your formula / approach is incorrect) (2 points) Geometric Mean of Salary Raises: Calculate the geometric mean of the salary raises using the percentage figures provided in the second column named “% Raise”. (The geometric mean for this calculation should be nearly identical to the arithmetic mean. If your answer deviates significantly from the mean, it's likely incorrect. 2 points) Starting salary % Raise Raise Salary after raise 75000 10% 7500 82500 82500 4% 3300…arrow_forwardI need help with this problem and an explanation of the solution for the image described below. (Statistics: Engineering Probabilities)arrow_forwardI need help with this problem and an explanation of the solution for the image described below. (Statistics: Engineering Probabilities)arrow_forward
- 310015 K Question 9, 5.2.28-T Part 1 of 4 HW Score: 85.96%, 49 of 57 points Points: 1 Save of 6 Based on a poll, among adults who regret getting tattoos, 28% say that they were too young when they got their tattoos. Assume that six adults who regret getting tattoos are randomly selected, and find the indicated probability. Complete parts (a) through (d) below. a. Find the probability that none of the selected adults say that they were too young to get tattoos. 0.0520 (Round to four decimal places as needed.) Clear all Final check Feb 7 12:47 US Oarrow_forwardhow could the bar graph have been organized differently to make it easier to compare opinion changes within political partiesarrow_forwardDraw a picture of a normal distribution with mean 70 and standard deviation 5.arrow_forward
- What do you guess are the standard deviations of the two distributions in the previous example problem?arrow_forwardPlease answer the questionsarrow_forward30. An individual who has automobile insurance from a certain company is randomly selected. Let Y be the num- ber of moving violations for which the individual was cited during the last 3 years. The pmf of Y isy | 1 2 4 8 16p(y) | .05 .10 .35 .40 .10 a.Compute E(Y).b. Suppose an individual with Y violations incurs a surcharge of $100Y^2. Calculate the expected amount of the surcharge.arrow_forward
- 24. An insurance company offers its policyholders a num- ber of different premium payment options. For a ran- domly selected policyholder, let X = the number of months between successive payments. The cdf of X is as follows: F(x)=0.00 : x < 10.30 : 1≤x<30.40 : 3≤ x < 40.45 : 4≤ x <60.60 : 6≤ x < 121.00 : 12≤ x a. What is the pmf of X?b. Using just the cdf, compute P(3≤ X ≤6) and P(4≤ X).arrow_forward59. At a certain gas station, 40% of the customers use regular gas (A1), 35% use plus gas (A2), and 25% use premium (A3). Of those customers using regular gas, only 30% fill their tanks (event B). Of those customers using plus, 60% fill their tanks, whereas of those using premium, 50% fill their tanks.a. What is the probability that the next customer will request plus gas and fill the tank (A2 B)?b. What is the probability that the next customer fills the tank?c. If the next customer fills the tank, what is the probability that regular gas is requested? Plus? Premium?arrow_forward38. Possible values of X, the number of components in a system submitted for repair that must be replaced, are 1, 2, 3, and 4 with corresponding probabilities .15, .35, .35, and .15, respectively. a. Calculate E(X) and then E(5 - X).b. Would the repair facility be better off charging a flat fee of $75 or else the amount $[150/(5 - X)]? [Note: It is not generally true that E(c/Y) = c/E(Y).]arrow_forward
 Big Ideas Math A Bridge To Success Algebra 1: Stu...AlgebraISBN:9781680331141Author:HOUGHTON MIFFLIN HARCOURTPublisher:Houghton Mifflin Harcourt
 Glencoe Algebra 1, Student Edition, 9780079039897...AlgebraISBN:9780079039897Author:CarterPublisher:McGraw Hill
 Holt Mcdougal Larson Pre-algebra: Student Edition...AlgebraISBN:9780547587776Author:HOLT MCDOUGALPublisher:HOLT MCDOUGAL