
Concept explainers
Videos
a.
Find the
a.
Answer to Problem 62SE
The mean and median are 2.95 and 3, respectively.
Explanation of Solution
Calculation:
The data represent the number of times a sample of 20 families dined out in the previous week.
Store the variable, “Number of times the families dined outside in the previous week” in Column C11 of a MINITAB worksheet.
Mean and Median:
Software Procedure:
Step-by-step procedure to obtain the mean and median using MINITAB software:
- Choose Stat > Basic Statistics > Display
Descriptive Statistics . - In Variables enter the columns C11.
- In Statistics select Mean and Median.
- Click OK.
The output obtained using MINITAB software is given below:
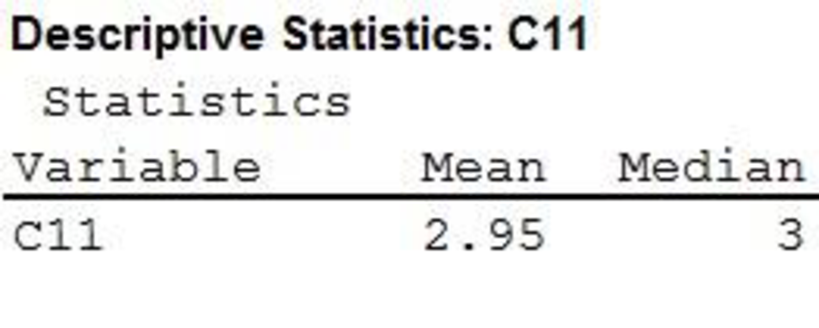
Thus, mean and median are 2.95 and 3, respectively.
b.
Find the first
b.
Answer to Problem 62SE
The first quartile is 1 and the third quartile is 4.75.
Explanation of Solution
Calculation:
First quartile and Third quartile:
Software Procedure:
Step-by-step procedure to obtain the first and third quartiles using MINITAB software:
- Choose Stat > Basic Statistics > Display Descriptive Statistics.
- In Variables enter the columns C11.
- In Statistics select First quartile and Third quartile.
- Click OK.
The output obtained using MINITAB software is given below:
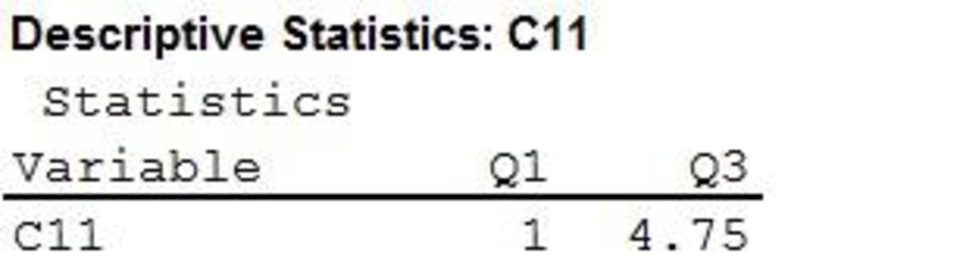
Thus, the first and third quartiles are 1 and 4.75, respectively.
c.
Find the
c.
Answer to Problem 62SE
The range and interquartile range are 7 and 3.75, respectively.
Explanation of Solution
Calculation:
Range, and Interquartile range:
Software Procedure:
Step-by-step procedure to obtain the range and interquartile range using the MINITAB software:
- Choose Stat > Basic Statistics >Display Descriptive Statistics.
- Click OK.
- In Variables, enter the column of C11.
- In Statistics select Range and Interquartile range.
- Click OK.
The output obtained using MINITAB software is given below:
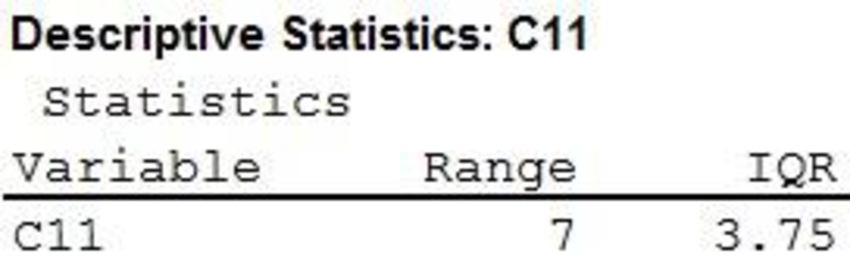
Thus, the range of the data is 7 and the interquartile range is 3.75.
d.
Find the variance and standard deviation.
d.
Answer to Problem 62SE
The variance and standard deviation are 4.366 and 2.089, respectively.
Explanation of Solution
Calculation:
Software Procedure:
Step-by-step procedure to obtain the variance and standard deviation using MINITAB software:
- Choose Stat > Basic Statistics >Display Descriptive Statistics.
- Click OK.
- In Variables, enter the column of C11.
- In Statistics select Variance and Standard deviation.
- Click OK.
The output obtained using MINITAB software is given below:
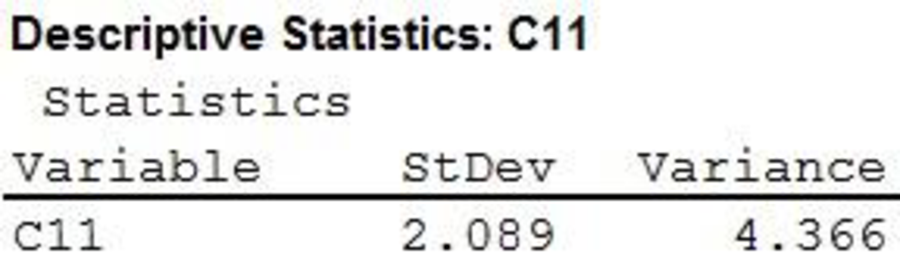
Thus, the variance of the data is 4.366 and the standard deviation is 2.089.
e.
Explain about the shape of the distribution and also explain the reason for the expected shape.
e.
Explanation of Solution
The given information is that the skewness measure for the data is 0.34.
Skewness:
- If the value of skewness is equal to zero, then the distribution is symmetric.
- If the skewness value is less than zero, then the distribution is negatively skewed.
- If the skewness value is greater than zero, then the distribution is positively skewed.
Here, the skewness is 0.34, which is greater than zero. Hence, the shape of the distribution is positively skewed.
f.
Check whether the data contain any outliers.
f.
Answer to Problem 62SE
The data has no outliers.
Explanation of Solution
Calculation:
The formula for the lower limit to detect outliers is as follows:
where
Substitute
Thus, the lower limit is –4.625.
The formula for the upper limit to detect outliers is as follows:
where
Substitute
Thus, the upper limit is 10.375.
Outlier:
The observation that falls outside of the overall pattern of the data is called an outlier.
The data values less than –4.625 or greater than 10.375 are considered as the outliers.
Here, all data values lie within the limits. Thus, the data have no outliers.
Want to see more full solutions like this?
Chapter 3 Solutions
MindTap Business Statistics, 1 term (6 months) Printed Access Card for Anderson/Sweeney/Williams/Camm/Cochran's Essentials of Statistics for Business and Economics, 8th


- 8. Recall, from Sect. 2.16.4, the likelihood ratio statistic, Ln, which was defined as a product of independent, identically distributed random variables with mean 1 (under the so-called null hypothesis), and the, sometimes more convenient, log-likelihood, log L, which was a sum of independent, identically distributed random variables, which, however, do not have mean log 1 = 0. (a) Verify that the last claim is correct, by proving the more general statement, namely that, if Y is a non-negative random variable with finite mean, then E(log Y) log(EY). (b) Prove that, in fact, there is strict inequality: E(log Y) < log(EY), unless Y is degenerate. (c) Review the proof of Jensen's inequality, Theorem 5.1. Generalize with a glimpse on (b).arrow_forward3. Prove that, for any random variable X, the minimum of E(X - a)² is attained for a = EX. Provedarrow_forward7. Cantelli's inequality. Let X be a random variable with finite variance, o². (a) Prove that, for x ≥ 0, P(X EX2x)≤ 02 x² +0² 202 P(|X - EX2x)<≤ (b) Find X assuming two values where there is equality. (c) When is Cantelli's inequality better than Chebyshev's inequality? (d) Use Cantelli's inequality to show that med (X) - EX ≤ o√√3; recall, from Proposition 6.1, that an application of Chebyshev's inequality yields the bound o√√2. (e) Generalize Cantelli's inequality to moments of order r 1.arrow_forward
- The college hiking club is having a fundraiser to buy new equipment for fall and winter outings. The club is selling Chinese fortune cookies at a price of $2 per cookie. Each cookie contains a piece of paper with a different number written on it. A random drawing will determine which number is the winner of a dinner for two at a local Chinese restaurant. The dinner is valued at $32. Since fortune cookies are donated to the club, we can ignore the cost of the cookies. The club sold 718 cookies before the drawing. Lisa bought 13 cookies. Lisa's expected earnings can be found by multiplying the value of the dinner by the probability that she will win. What are Lisa's expected earnings? Round your answer to the nearest cent.arrow_forwardThe Honolulu Advertiser stated that in Honolulu there was an average of 659 burglaries per 400,000 households in a given year. In the Kohola Drive neighborhood there are 321 homes. Let r be the number of homes that will be burglarized in a year. Use the formula for Poisson distribution. What is the value of p, the probability of success, to four decimal places?arrow_forwardThe college hiking club is having a fundraiser to buy new equipment for fall and winter outings. The club is selling Chinese fortune cookies at a price of $2 per cookie. Each cookie contains a piece of paper with a different number written on it. A random drawing will determine which number is the winner of a dinner for two at a local Chinese restaurant. The dinner is valued at $32. Since fortune cookies are donated to the club, we can ignore the cost of the cookies. The club sold 718 cookies before the drawing. Lisa bought 13 cookies. Lisa's expected earnings can be found by multiplying the value of the dinner by the probability that she will win. What are Lisa's expected earnings? Round your answer to the nearest cent.arrow_forward
- What was the age distribution of nurses in Great Britain at the time of Florence Nightingale? Thanks to Florence Nightingale and the British census of 1851, we have the following information (based on data from the classic text Notes on Nursing, by Florence Nightingale). Note: In 1851 there were 25,466 nurses in Great Britain. Furthermore, Nightingale made a strict distinction between nurses and domestic servants. Use a histogram and graph the probability distribution. Using the graph of the probability distribution determine the probability that a British nurse selected at random in 1851 would be 40 years of age or older. Round your answer to nearest thousandth. Age range (yr) 20–29 30–39 40–49 50–59 60–69 70–79 80+ Midpoint (x) 24.5 34.5 44.5 54.5 64.5 74.5 84.5 Percent of nurses 5.7% 9.7% 19.5% 29.2% 25.0% 9.1% 1.8%arrow_forwardWhat was the age distribution of nurses in Great Britain at the time of Florence Nightingale? Thanks to Florence Nightingale and the British census of 1851, we have the following information (based on data from the classic text Notes on Nursing, by Florence Nightingale). Note: In 1851 there were 25,466 nurses in Great Britain. Furthermore, Nightingale made a strict distinction between nurses and domestic servants. Use a histogram and graph the probability distribution. Using the graph of the probability distribution determine the probability that a British nurse selected at random in 1851 would be 40 years of age or older. Round your answer to nearest thousandth. Age range (yr) 20–29 30–39 40–49 50–59 60–69 70–79 80+ Midpoint (x) 24.5 34.5 44.5 54.5 64.5 74.5 84.5 Percent of nurses 5.7% 9.7% 19.5% 29.2% 25.0% 9.1% 1.8%arrow_forwardThere are 4 radar stations and the probability of a single radar station detecting an enemy plane is 0.55. Make a histogram for the probability distribution.arrow_forward
- show all stepsarrow_forwardMost people know that the probability of getting a head when you flip a fair coin is . You want to use the relative frequency of the event to show that the probability is . How many times should you simulate flipping the coin in the experiment? Would it be better to use 300 trials or 3000 trials? Explain.arrow_forwardThe qualified applicant pool for eight management trainee positions consists of ten women and six men. How many different groups of applicants can be selected for the positionsarrow_forward
 Glencoe Algebra 1, Student Edition, 9780079039897...AlgebraISBN:9780079039897Author:CarterPublisher:McGraw Hill
 Big Ideas Math A Bridge To Success Algebra 1: Stu...AlgebraISBN:9781680331141Author:HOUGHTON MIFFLIN HARCOURTPublisher:Houghton Mifflin Harcourt
 College Algebra (MindTap Course List)AlgebraISBN:9781305652231Author:R. David Gustafson, Jeff HughesPublisher:Cengage Learning