
Concept explainers
Videos
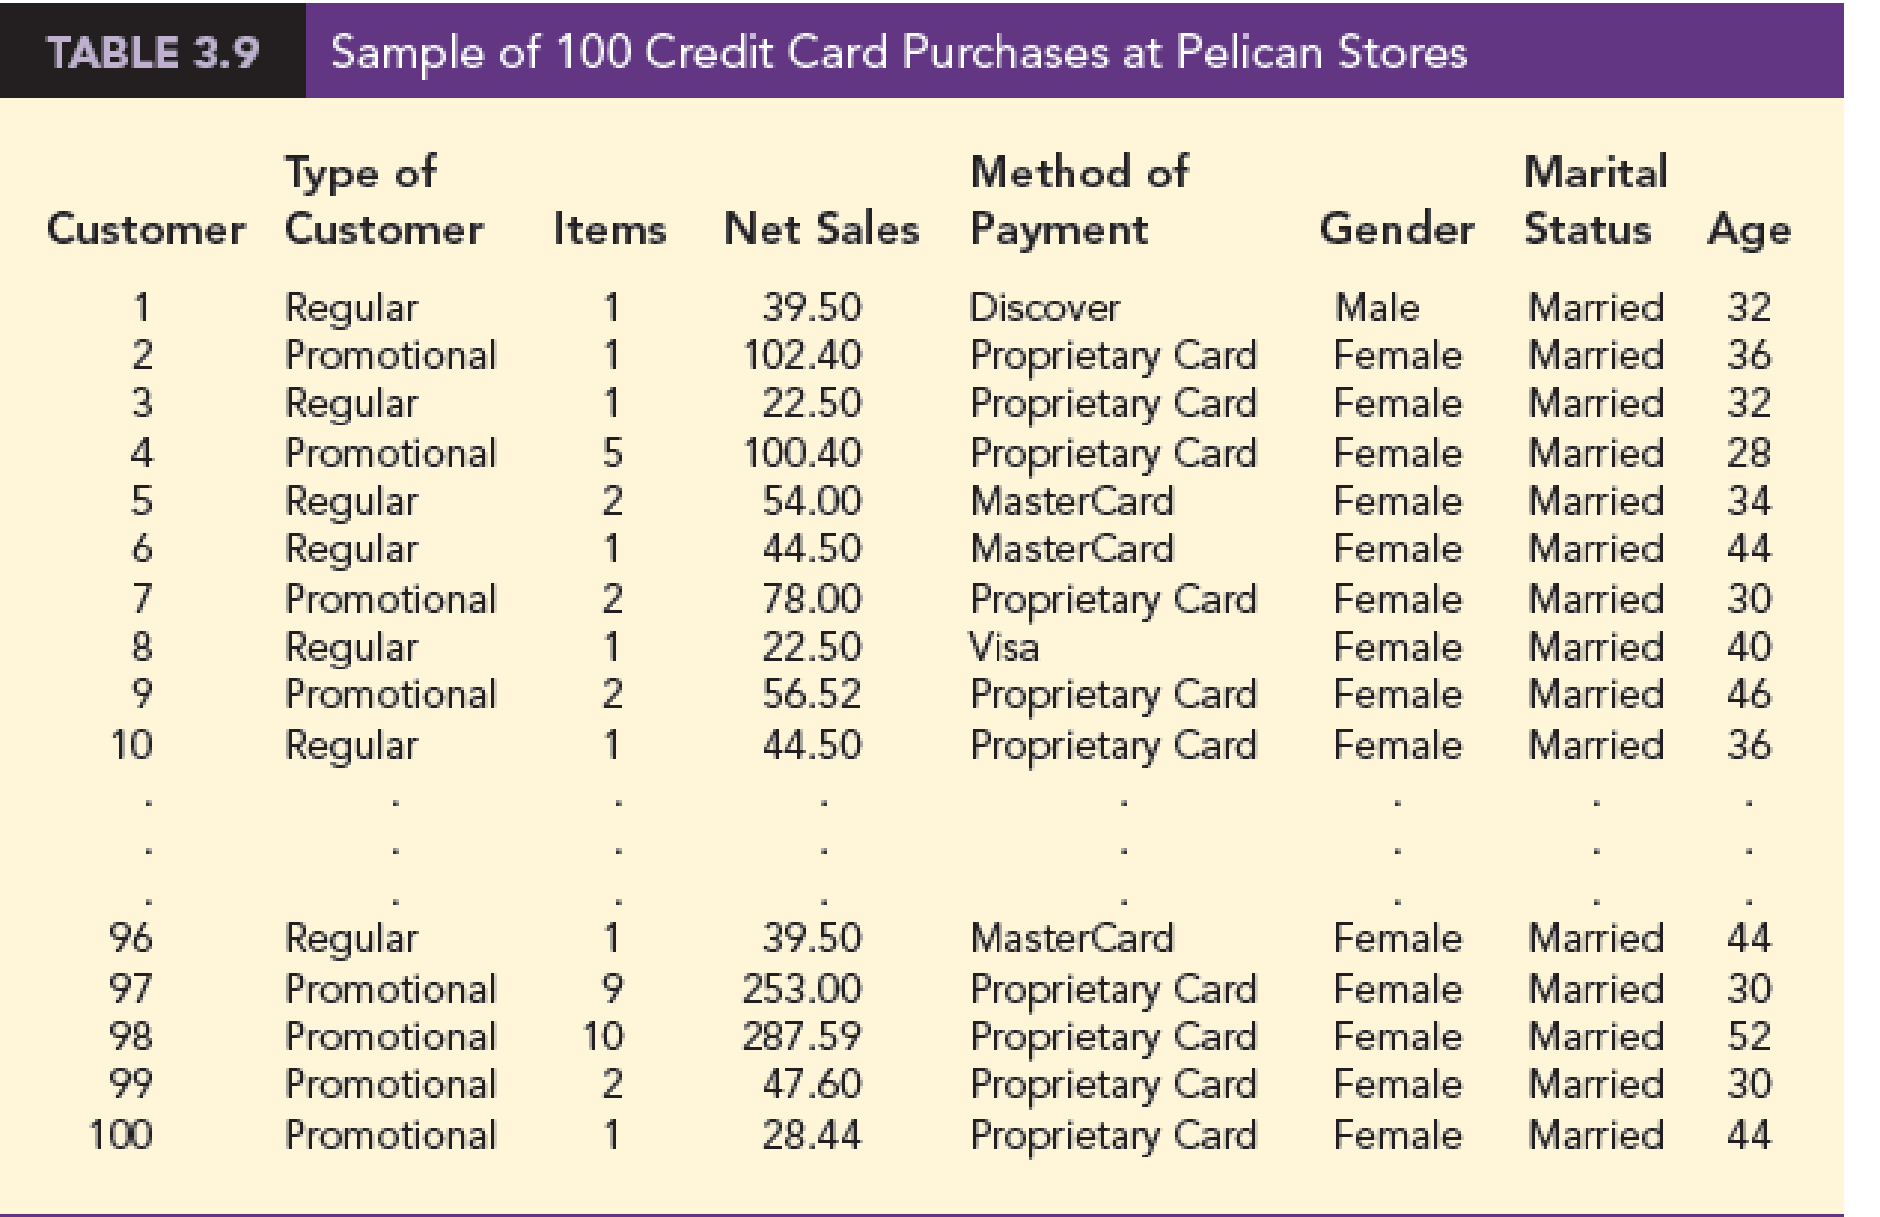
Pelican Stores, a division of National Clothing, is a chain of women’s apparel stores operating throughout the country. The chain recently ran a promotion in which discount coupons were sent to customers of other National Clothing stores. Data collected for a sample of 100 in-store credit card transactions at Pelican Stores during one day while the promotion was running are contained in the file named PelicanStores. Table 3.9 shows a portion of the data set. The proprietary card method of payment refers to charges made using a National Clothing charge card. Customers who made a purchase using a discount coupon are referred to as promotional customers and customers who made a purchase but did not use a discount coupon are referred to as regular customers. Because the promotional coupons were not sent to regular Pelican Stores customers, management considers the sales made to people presenting the promotional coupons as sales it would not otherwise make. Of course, Pelican also hopes that the promotional customers will continue to shop at its stores.
Most of the variables shown in Table 3.9 are self-explanatory, but two of the variables require some clarification.
Items The total number of items purchased
Net Sales The total amount ($) charged to the credit card
Pelican’s management would like to use this sample data to learn about its customer base and to evaluate the promotion involving discount coupons.
Managerial Report
Use the methods of
- 1. Descriptive statistics on net sales and descriptive statistics on net sales by various classifications of customers.
- 2. Descriptive statistics concerning the relationship between age and net sales.

Trending nowThis is a popular solution!

Chapter 3 Solutions
MindTap Business Statistics, 1 term (6 months) Printed Access Card for Anderson/Sweeney/Williams/Camm/Cochran's Essentials of Statistics for Business and Economics, 8th


- 27 Suppose that you have a data set of 1, 2, 2, 3, 3, 3, 4, 4, 5, and you assume that this sample represents a population. The mean is 3 and g the standard deviation is 1.225.10 a. Explain why you can apply the empirical rule to this data set. b. Where would "most of the values" in the population fall, based on this data set?arrow_forward30 Explain how you can use the empirical rule to find out whether a data set is mound- shaped, using only the values of the data themselves (no histogram available).arrow_forward5. Let X be a positive random variable with finite variance, and let A = (0, 1). Prove that P(X AEX) 2 (1-A)² (EX)² EX2arrow_forward
- 6. Let, for p = (0, 1), and xe R. X be a random variable defined as follows: P(X=-x) = P(X = x)=p. P(X=0)= 1-2p. Show that there is equality in Chebyshev's inequality for X. This means that Chebyshev's inequality, in spite of being rather crude, cannot be improved without additional assumptions.arrow_forward4. Prove that, for any random variable X, the minimum of EIX-al is attained for a = med (X).arrow_forward8. Recall, from Sect. 2.16.4, the likelihood ratio statistic, Ln, which was defined as a product of independent, identically distributed random variables with mean 1 (under the so-called null hypothesis), and the, sometimes more convenient, log-likelihood, log L, which was a sum of independent, identically distributed random variables, which, however, do not have mean log 1 = 0. (a) Verify that the last claim is correct, by proving the more general statement, namely that, if Y is a non-negative random variable with finite mean, then E(log Y) log(EY). (b) Prove that, in fact, there is strict inequality: E(log Y) < log(EY), unless Y is degenerate. (c) Review the proof of Jensen's inequality, Theorem 5.1. Generalize with a glimpse on (b).arrow_forward
- 3. Prove that, for any random variable X, the minimum of E(X - a)² is attained for a = EX. Provedarrow_forward7. Cantelli's inequality. Let X be a random variable with finite variance, o². (a) Prove that, for x ≥ 0, P(X EX2x)≤ 02 x² +0² 202 P(|X - EX2x)<≤ (b) Find X assuming two values where there is equality. (c) When is Cantelli's inequality better than Chebyshev's inequality? (d) Use Cantelli's inequality to show that med (X) - EX ≤ o√√3; recall, from Proposition 6.1, that an application of Chebyshev's inequality yields the bound o√√2. (e) Generalize Cantelli's inequality to moments of order r 1.arrow_forwardThe college hiking club is having a fundraiser to buy new equipment for fall and winter outings. The club is selling Chinese fortune cookies at a price of $2 per cookie. Each cookie contains a piece of paper with a different number written on it. A random drawing will determine which number is the winner of a dinner for two at a local Chinese restaurant. The dinner is valued at $32. Since fortune cookies are donated to the club, we can ignore the cost of the cookies. The club sold 718 cookies before the drawing. Lisa bought 13 cookies. Lisa's expected earnings can be found by multiplying the value of the dinner by the probability that she will win. What are Lisa's expected earnings? Round your answer to the nearest cent.arrow_forward
- The Honolulu Advertiser stated that in Honolulu there was an average of 659 burglaries per 400,000 households in a given year. In the Kohola Drive neighborhood there are 321 homes. Let r be the number of homes that will be burglarized in a year. Use the formula for Poisson distribution. What is the value of p, the probability of success, to four decimal places?arrow_forwardThe college hiking club is having a fundraiser to buy new equipment for fall and winter outings. The club is selling Chinese fortune cookies at a price of $2 per cookie. Each cookie contains a piece of paper with a different number written on it. A random drawing will determine which number is the winner of a dinner for two at a local Chinese restaurant. The dinner is valued at $32. Since fortune cookies are donated to the club, we can ignore the cost of the cookies. The club sold 718 cookies before the drawing. Lisa bought 13 cookies. Lisa's expected earnings can be found by multiplying the value of the dinner by the probability that she will win. What are Lisa's expected earnings? Round your answer to the nearest cent.arrow_forwardWhat was the age distribution of nurses in Great Britain at the time of Florence Nightingale? Thanks to Florence Nightingale and the British census of 1851, we have the following information (based on data from the classic text Notes on Nursing, by Florence Nightingale). Note: In 1851 there were 25,466 nurses in Great Britain. Furthermore, Nightingale made a strict distinction between nurses and domestic servants. Use a histogram and graph the probability distribution. Using the graph of the probability distribution determine the probability that a British nurse selected at random in 1851 would be 40 years of age or older. Round your answer to nearest thousandth. Age range (yr) 20–29 30–39 40–49 50–59 60–69 70–79 80+ Midpoint (x) 24.5 34.5 44.5 54.5 64.5 74.5 84.5 Percent of nurses 5.7% 9.7% 19.5% 29.2% 25.0% 9.1% 1.8%arrow_forward
 Glencoe Algebra 1, Student Edition, 9780079039897...AlgebraISBN:9780079039897Author:CarterPublisher:McGraw Hill
 Holt Mcdougal Larson Pre-algebra: Student Edition...AlgebraISBN:9780547587776Author:HOLT MCDOUGALPublisher:HOLT MCDOUGAL
 Big Ideas Math A Bridge To Success Algebra 1: Stu...AlgebraISBN:9781680331141Author:HOUGHTON MIFFLIN HARCOURTPublisher:Houghton Mifflin Harcourt