Essentials of Corporate Finance (Mcgraw-hill/Irwin Series in Finance, Insurance, and Real Estate)
9th Edition
ISBN: 9781259277214
Author: Stephen A. Ross Franco Modigliani Professor of Financial Economics Professor, Randolph W Westerfield Robert R. Dockson Deans Chair in Bus. Admin., Bradford D Jordan Professor
Publisher: McGraw-Hill Education
expand_more
expand_more
format_list_bulleted
Textbook Question
Chapter 3, Problem 46QP
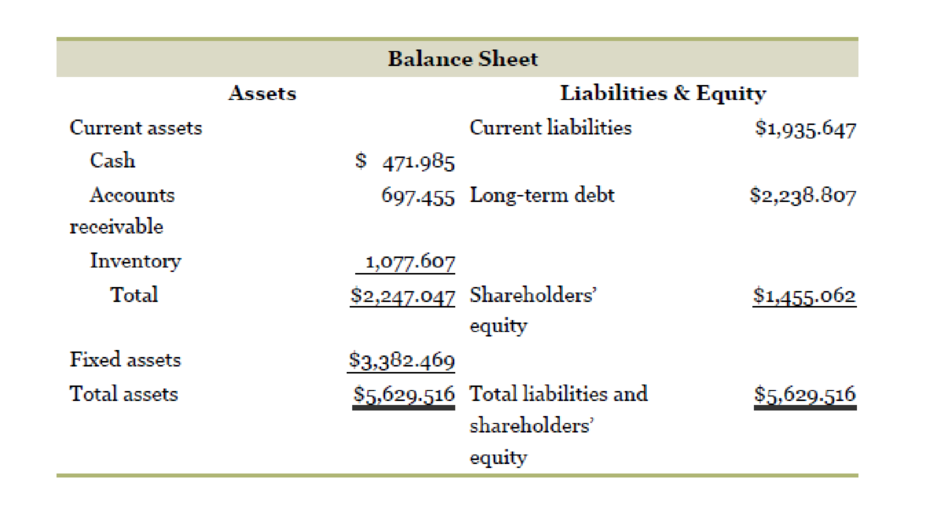
Expanded DuPont Identity. Hershey Co. reported the following income statement and
| Income Statement | |
| Sales | $7,421,768 |
| CoGS | 4,085.602 |
| Other costs | 1,770.279 |
| 176.312 | |
| EBIT | $1,389.575 |
| Interest | 83.532 |
| EBT | $1,306.043 |
| Taxes | 459.131 |
| Net income | $846.912 |

Expert Solution & Answer
Want to see the full answer?
Check out a sample textbook solution
Students have asked these similar questions
find the balance after 7years if $55000 is invested at 6% p.a. compound annually
How does risk-adjusted return, such as the Sharpe Ratio, influence portfolio selection beyond just expected return?
Please provide a reference
How do investors determine an acceptable level of risk when building their portfolios? Is it purely based on financial goals, or are there specific models that guide these decisions?
Please provide a reference
Chapter 3 Solutions
Essentials of Corporate Finance (Mcgraw-hill/Irwin Series in Finance, Insurance, and Real Estate)
Ch. 3.1 - Why is it often necessary to standardize financial...Ch. 3.1 - Prob. 3.1BCQCh. 3.2 - What are the five groups of ratios? Give two or...Ch. 3.2 - Turnover ratios all have one of two figures as...Ch. 3.2 - Profitability ratios all have the same figure in...Ch. 3.2 - Given the total debt ratio, what other two ratios...Ch. 3.3 - Return on assets, or ROA, can be expressed as the...Ch. 3.3 - Return on equity, or ROE, can be expressed as the...Ch. 3.4 - What does a firms internal growth rate tell us?Ch. 3.4 - What does a firms sustainable growth rate tell us?
Ch. 3.4 - Why is the sustainable growth rate likely to be...Ch. 3.5 - Prob. 3.5ACQCh. 3.5 - Prob. 3.5BCQCh. 3.5 - Prob. 3.5CCQCh. 3.5 - Prob. 3.5DCQCh. 3 - Section 3.1A common-size balance sheet expresses...Ch. 3 - What are the categories of traditional financial...Ch. 3 - Prob. 3.3CCh. 3 - Prob. 3.4CCh. 3 - Prob. 3.5CCh. 3 - Current Ratio. What effect would the following...Ch. 3 - Current Ratio and Quick Ratio. In recent years,...Ch. 3 - Prob. 3CTCRCh. 3 - Financial Ratios. Fully explain the kind of...Ch. 3 - Standardized Financial Statements. What types of...Ch. 3 - Prob. 6CTCRCh. 3 - Prob. 7CTCRCh. 3 - Prob. 8CTCRCh. 3 - Industry-Specific Ratios. So-called same-store...Ch. 3 - Industry-Specific Ratios. There are many ways of...Ch. 3 - Prob. 11CTCRCh. 3 - Financial Statement Analysis. In the previous...Ch. 3 - Prob. 1QPCh. 3 - Calculating Profitability Ratios. Aguilera, Inc.,...Ch. 3 - Calculating the Average Collection Period. Ordonez...Ch. 3 - Calculating Inventory Turnover. Bobaflex...Ch. 3 - Calculating Leverage Ratios. Fincher, Inc., has a...Ch. 3 - Calculating Market Value Ratios. Rossdale, Inc.,...Ch. 3 - Prob. 7QPCh. 3 - DuPont Identity. Jiminy Cricket Removal has a...Ch. 3 - Calculating Average Payables Period. For the past...Ch. 3 - Equity Multiplier and Return on Equity. Shelton...Ch. 3 - Internal Growth. If Williams, Inc., has an ROA of...Ch. 3 - Sustainable Growth. If the Crash Davis Driving...Ch. 3 - Sustainable Growth. Based on the following...Ch. 3 - Prob. 14QPCh. 3 - Prob. 15QPCh. 3 - Calculating Financial Ratios. Based on the balance...Ch. 3 - DuPont Identity. Suppose that the Bethesda Mining...Ch. 3 - Prob. 18QPCh. 3 - Return on Assets. Beckinsale, Inc., has a profit...Ch. 3 - Calculating Internal Growth. The most recent...Ch. 3 - Calculating Sustainable Growth. For Shinoda...Ch. 3 - Total Asset Turnover. Kalebs Karate Supply had a...Ch. 3 - Return on Equity. Carroll, Inc., has a total debt...Ch. 3 - Market Value Ratios. Ames, Inc., has a current...Ch. 3 - Prob. 25QPCh. 3 - Enterprise ValueEBITDA Multiple. The market value...Ch. 3 - Prob. 27QPCh. 3 - Ratios and Fixed Assets. The Smathers Company has...Ch. 3 - Prob. 29QPCh. 3 - Prob. 30QPCh. 3 - Prob. 31QPCh. 3 - Calculating the Times Interest Earned Ratio. For...Ch. 3 - Return on Assets. A fire has destroyed a large...Ch. 3 - Prob. 34QPCh. 3 - SMOLIRA GOLF. INC. 2016 Income Statement Sales...Ch. 3 - Prob. 36QPCh. 3 - Market Value Ratios. Smolira Golf has 10,000...Ch. 3 - Interpreting Financial Ratios. After calculating...Ch. 3 - Growth and Profit Margin. Fulkerson Manufacturing...Ch. 3 - Market Value Ratios. Abercrombie Fitch and...Ch. 3 - Growth and Assets. A firm wishes to maintain an...Ch. 3 - Prob. 42QPCh. 3 - Prob. 43QPCh. 3 - Constraints on Growth. High Flyer, Inc., wishes to...Ch. 3 - Internal and Sustainable Growth Rates. Best Buy...Ch. 3 - Expanded DuPont Identity. Hershey Co. reported the...Ch. 3 - Ratios and Financial Planning at SS Air, Inc....Ch. 3 - Prob. 2CCCh. 3 - Prob. 3CCCh. 3 - Ratios and Financial Planning at SS Air, Inc....
Knowledge Booster
Learn more about
Need a deep-dive on the concept behind this application? Look no further. Learn more about this topic, finance and related others by exploring similar questions and additional content below.Similar questions
- Your firm is considering an expansion of its operations into a nearby geographic area that the firm is currently not serving. This would require an up-front investment (startup cost) of $989,060.00, to be made immediately. Here are the forecasts that were prepared for this project, shown in the image. The long-term growth rate for cash flows after year 4 is expected to be 4.73%. The cost of capital appropriate for this project is 12.48%. What is the NPV, Profitability Index, IRR and payback in this case?arrow_forwardUse the binomial method to determine the value of an American Put option at time t = 0. The option expires at time t = T = 1/2 and has exercise price E = 55. The current value of the underlying is S(0) = 50 with the underlying paying continuous dividends at the rate D = 0.05. The interest rate is r = 0.3. Use a time step of St = 1/6. Consider the case of p = 1/2 and suppose the volatility is σ = 0.3. Perform all calculations using a minimum of 4 decimal places of accuracy. =arrow_forwardConsider a European chooser option with exercise price E₁ and expiry date T₁ where the relevant put and call options, which depend on the value of the same underlying asset S, have the same exercise price E2 and expiry date T₂. Determine, in terms of other elementary options, the value of the chooser option for the special case when T₁ = T2. Clearly define all notation that you use.arrow_forward
- The continuous conditional probability density function pc(S, t; S', t') for a risk neutral lognormal random walk is given by Pc(S, t; S', t') = 1 σS'√2π(t' - t) - (log(S/S) (ro²)(t − t)] exp 202 (t't) In the binomial method, the value of the underlying is Sm at time step môt and the value of the underlying at time step (m + 1)St is Sm+1. For this case evaluate Ec[(Sm+1)k|Sm] = [°° (S')*pc(S™, mdt; S', (m + 1)8t)dS' showing all steps, where k is a positive integer with k ≥ 1. You may assume that 1 e (x-n)2 2s2dx = 1 for all real numbers n and s with s > 0.arrow_forwardJohn and Jane Doe, a married couple filing jointly, have provided you with their financial information for the year, including details of federal income tax withheld. They need assistance in preparing their tax return. W-2 Income: John earns $150,000 with $35,000 withheld for federal income tax. Jane earns $85,000 with $15,500 withheld for federal income tax. Interest Income: They received $2500 in interest from a savings account, with no tax withheld. Child Tax Credit: They have two children under the age of 17. Mortgage Interest: Paid $28,000 in mortgage interest on their primary residence. Property Taxes: Paid $4,800 in property taxes on their primary residence. Charitable Donations: Donated $22,000 to qualifying charitable organizations. Other Deductions: They have no other deductions to claim. You will gather the appropriate information and complete the forms provided in Blackboard (1040, Schedule A, and Schedule B in preparation of their tax file.arrow_forwardOn the issue date, you bought a 20-year maturity, 5.85% semi-annual coupon bond. The bond then sold at YTM of 6.25%. Now, 5 years later, the similar bond sells at YTM of 5.25%. If you hold the bond now, what is your realized rate of return for the 5-year holding period?arrow_forward
- Bond Valuation with Semiannual Payments Renfro Rentals has issued bonds that have an 11% coupon rate, payable semiannually. The bonds mature in 17 years, have a face value of $1,000, and a yield to maturity of 9.5%. What is the price of the bonds? Round your answer to the nearest cent.arrow_forwardanalyze at least three financial banking products from both the liability side (like time deposits, fixed income, stocks, structure products, etc). You will need to examine aspects such as liquidity, risk, and profitability from a company and an individual point of view.arrow_forwardHow a does researcher ensure that consulting recommendations are data-driven? What does make it effective, and sustainable? Please help explain and give the example How does DMAC help researchers to improve their business processes? How to establish feedback loops for ongoing refinement. Please give the examplesarrow_forward
arrow_back_ios
SEE MORE QUESTIONS
arrow_forward_ios
Recommended textbooks for you
 Financial Accounting: The Impact on Decision Make...AccountingISBN:9781305654174Author:Gary A. Porter, Curtis L. NortonPublisher:Cengage Learning
 PFIN (with PFIN Online, 1 term (6 months) Printed...FinanceISBN:9781337117005Author:Randall Billingsley, Lawrence J. Gitman, Michael D. JoehnkPublisher:Cengage Learning
 EBK CONTEMPORARY FINANCIAL MANAGEMENTFinanceISBN:9781337514835Author:MOYERPublisher:CENGAGE LEARNING - CONSIGNMENT
 Financial And Managerial AccountingAccountingISBN:9781337902663Author:WARREN, Carl S.Publisher:Cengage Learning,

Financial Accounting: The Impact on Decision Make...
Accounting
ISBN:9781305654174
Author:Gary A. Porter, Curtis L. Norton
Publisher:Cengage Learning


PFIN (with PFIN Online, 1 term (6 months) Printed...
Finance
ISBN:9781337117005
Author:Randall Billingsley, Lawrence J. Gitman, Michael D. Joehnk
Publisher:Cengage Learning


EBK CONTEMPORARY FINANCIAL MANAGEMENT
Finance
ISBN:9781337514835
Author:MOYER
Publisher:CENGAGE LEARNING - CONSIGNMENT

Financial And Managerial Accounting
Accounting
ISBN:9781337902663
Author:WARREN, Carl S.
Publisher:Cengage Learning,
Financial ratio analysis; Author: The Finance Storyteller;https://www.youtube.com/watch?v=MTq7HuvoGck;License: Standard Youtube License