Concept explainers
Videos
Think about how the finch bill data demonstrate Darwin’s postulates.
- a. What would figure 3.10 have looked like if bill depth was not variable?
- b. What would figure 3.15 look like if bill depth was variable but the variation was not heritable?
- c. In figure 3.11, why is the line drawn from 1978 data, alter the drought, higher on the vertical axis than the line drawn front 1976 data, before the drought?
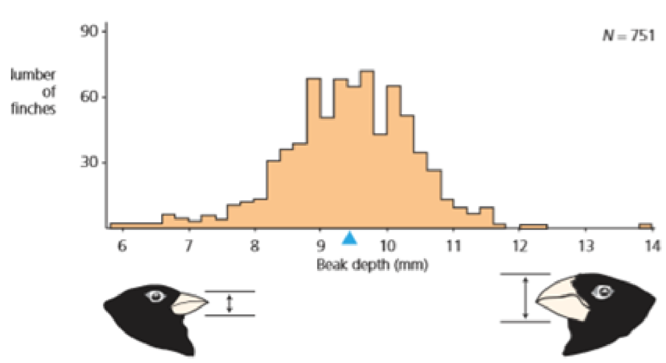
Figure 3.10 Variation In beak depth in medium ground finches This histogram shows the distribution of beak depth in medium ground finches on Daphne Major in 1976. A few birds have shallow beaks; a few birds have deep beaks, most birds have medium beaks. N stands for
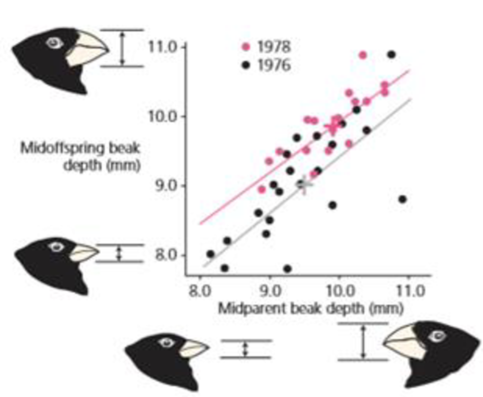
Figure 3.11 Heritability of beak depth in Geospiza fortfs This graph shows the relationship between the beak depth of parents and their offspring. Mid parent value is the average of the mother and father; mid offspring value is the average of the offspring. The lines in the graph are statistical best-fit lines. Data for both 1978 and 1976 show a strong relationship between the beak depth of parents and their offspring. Redrawn from Boag (1983).
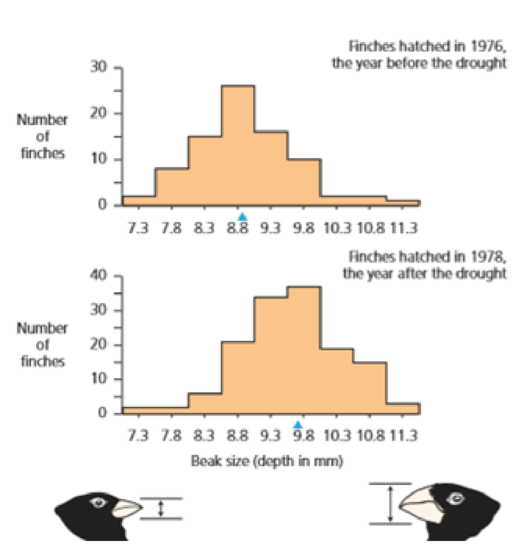
Figure 3.15 Beak depth in the finches hatched the year before the drought versus the year after the drought The red triangles represent population means Redrawn from Grant and Grant (2003).
Want to see the full answer?
Check out a sample textbook solution
Chapter 3 Solutions
Evolutionary Analysis (5th Edition)
Additional Science Textbook Solutions
Biological Science (6th Edition)
Biology: Life on Earth with Physiology (11th Edition)
Campbell Biology in Focus (2nd Edition)
Chemistry: A Molecular Approach (4th Edition)


- Identify the indicated tissue. (Tilia stem x.s.) parenchyma collenchyma sclerenchyma xylem phloem none of thesearrow_forwardIdentify the indicated structure. (Cucurbita stem l.s.) pit lenticel stomate tendril none of thesearrow_forwardIdentify the specific cell? (Zebrina leaf peel) vessel element sieve element companion cell tracheid guard cell subsidiary cell none of thesearrow_forward
- What type of cells flank the opening on either side? (leaf x.s.) vessel elements sieve elements companion cells tracheids guard cells none of thesearrow_forwardWhat specific cell is indicated. (Cucurbita stem I.s.) vessel element sieve element O companion cell tracheid guard cell none of thesearrow_forwardWhat specific cell is indicated? (Aristolochia stem x.s.) vessel element sieve element ○ companion cell O O O O O tracheid O guard cell none of thesearrow_forward
- Identify the tissue. parenchyma collenchyma sclerenchyma ○ xylem O phloem O none of thesearrow_forwardPlease answer q3arrow_forwardRespond to the following in a minimum of 175 words: How might CRISPR-Cas 9 be used in research or, eventually, therapeutically in patients? What are some potential ethical issues associated with using this technology? Do the advantages of using this technology outweigh the disadvantages (or vice versa)? Explain your position.arrow_forward
- You are studying the effect of directional selection on body height in three populations (graphs a, b, and c below). (a) What is the selection differential? Show your calculation. (2 pts) (b) Which population has the highest narrow sense heritability for height? Explain your answer. (2 pts) (c) If you examined the offspring in the next generation in each population, which population would have the highest mean height? Why? (2 pts) (a) Midoffspring height (average height of offspring) Short Short Short Short (c) Short (b) Short Tall Short Tall Short Short Tall Midparent height (average height of Mean of population = 65 inches Mean of breading parents = 70 inches Mean of population = 65 inches Mean of breading parents = 70 inches Mean of population = 65 inches Mean of breading parents = 70 inchesarrow_forwardP You are studying a population of 100 flowers that has two alleles at a locus for flower color, blue (B) and green (G). There are 15 individuals with the BB genotype, 70 individuals with the BG genotype, and 15 individuals with the GG genotype. (a) What are the allele frequencies of B and G in the starting population? Show your calculations. (2 pts) (b) Is this population in Hardy-Weinberg equilibrium? Show your calculations. (3 pts) 12pt v Paragraph BIU UA AV & VT2V f CO Varrow_forwardIn a natural population of outbreeding plants, the variance of the total number of seeds per plant is 16. From the natural population, 20 plants are taken into the laboratory and developed into separate true-breeding lines by self- fertilization-with selection for high, low, or medium number of seeds-for 10 generations. The average variance in the tenth generation in each of the 20 sets is about equal and averages 5.8 across all the sets. Estimate the broad-sense heritability for seed number in this population. (4 pts) 12pt v Paragraph BIUA V V T² v B ① O wordsarrow_forward
 Biology: The Dynamic Science (MindTap Course List)BiologyISBN:9781305389892Author:Peter J. Russell, Paul E. Hertz, Beverly McMillanPublisher:Cengage Learning
 Biology (MindTap Course List)BiologyISBN:9781337392938Author:Eldra Solomon, Charles Martin, Diana W. Martin, Linda R. BergPublisher:Cengage Learning
 Human Heredity: Principles and Issues (MindTap Co...BiologyISBN:9781305251052Author:Michael CummingsPublisher:Cengage Learning
 Biology Today and Tomorrow without Physiology (Mi...BiologyISBN:9781305117396Author:Cecie Starr, Christine Evers, Lisa StarrPublisher:Cengage Learning
 Concepts of BiologyBiologyISBN:9781938168116Author:Samantha Fowler, Rebecca Roush, James WisePublisher:OpenStax College