
Concept explainers
Videos
Improving Service Time at Dave’s Burgers
Dave’s Burgers is a fast-food restaurant franchise in Georgia, South Carolina, and North Carolina. Recently, Dave’s Burgers has followed the lead of larger franchise restaurants like Burger King, McDonald’s, and Wendy’s and constructed drive-through windows at all its locations. However, instead of making Dave’s Burgers more competitive, the drive-through windows have been a source of continual problems and it has lost market share to its larger competitors in almost all locations. To identify and correct the problems, top management has selected three of its restaurants (one in each state) as test sites and has implemented a
The Charlotte Dave’s Burgers franchise implemented a number of production process changes to improve service time at the drive-through window. It provided all employees with more training across all restaurant functions, improved the headset system, improved the equipment layout, developed clearer signs for customers, streamlined the menu, and initiated even-dollar (tax-inclusive) pricing to speed the payment process. Most importantly, the restaurant installed large, visible electronic timers that showed how long a customer was at the window. This not only allowed the quality team to measure service speed but also provided employees with a constant reminder that a customer was waiting.
These quality improvements were implemented over several months, and their effect was immediate. Service speed was obviously improved, and market share at the Charlotte restaurant increased by 5%. To maintain quality service, make sure the service time remained fast, and continue to improve service, the quality team decided to use a statistical process control chart on a continuing basis. They collected six service time observations daily over a 15-day period, as follows:
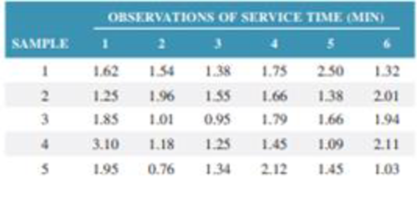
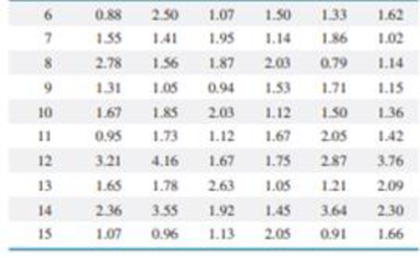
Construct a control chart to monitor the service at the drive-through window. Determine if your control chart can be implemented on a continuing basis or if additional observations need to be collected. Explain why the chart you developed can or cannot be used. Also discuss what other statistical process control charts Dave’s Burgers might use in its overall quality-management program.
Want to see the full answer?
Check out a sample textbook solution
Chapter 3 Solutions
Operations and Supply Chain Management 9th edition
Additional Business Textbook Solutions
Accounting Information Systems (14th Edition)
Horngren's Accounting (12th Edition)
Horngren's Financial & Managerial Accounting, The Financial Chapters (Book & Access Card)
Financial Accounting (12th Edition) (What's New in Accounting)
Engineering Economy (17th Edition)
Gitman: Principl Manageri Finance_15 (15th Edition) (What's New in Finance)


- Learning Activity 6: Canadian Business This Year Read the following webpage: The Business Development Bank of Canada. (2023). Canadian economic outlook for 2024: Shifting into neutral. https://www.bdc.ca/en/articles- tools/blog/canadian-economic-outlook-for-2024- shifting-into-neutral "Despite persistently high inflation and rising. interest rates, the news was generally better than expected for the Canadian economy in 2023" (BDC Blog 2024). Discussion Question: In your view, what are the most pressing problems for Canadian companies or consumers in 2024? Explain your answer using current examples of companies or consumer concerns.arrow_forwardTravelling and working internationally can lead to a life of adventure and unique career experiences. For businesses, selecting the right candidates to take on foreign assignments can propel, delay, or deny the success of the international ventures. As an international manager, identify key competencies you would look for in choosing expatriates. What might be some of their concerns in taking on overseas assignments? What are some best practices in supporting expats during and after their assignments?arrow_forwardResearch proposal: The Investigation of Career Development and Job satisfaction atEskom Rotek Industries 1. Introduction (250 words) 2. Research Context: Background (Research Context: Background (250 words) 3. The Research Problem (The Research Problem) 4. Aim of the study (Maximum 50 words) 5. Research Objectives (3 in total) 6. Research Questions (3 in total) 7. Justification or rationale of the study (150 words) 8. Literature Review (2-3 pages / 1000-1500 words) 9. Research Design and Methodology (1 - 2 page in total, from 9.1 to 9.6) 9.1 Research Philosophy 9.2 Research Methodology 9.3 Target Population and Sampling strategy 9.4 Data Collection 9.5 Data Analysis (100 words) 9.6 Pilot Study 10. Ethical considerations 11. Referencearrow_forward
- With your experience and research, discuss;(a) what type of “Leadership Style” is used in communications services (Digicel Group Limited)?(b) whether the style used is successful or not and why. Justify your position with relevant citation and references ( Rubic is attached to guide the essay ) NOTE: NO AI RESPONSES PLEASEarrow_forwardby the end of 2013, the IPL port was operational and the naphtha was flowing to the Himachal Fertilizer Corporation (HFC) plant in Central India after being granted the port contract in Summer 2012. The plant was located in an industrial area that had several pipelines in the general geographic area including a crude oil pipeline leading to a refinery, and a pipeline carrying pesticides to be processed and redistributed to local farms in the area. In July 2014, Ajay Patel, the logistics general manager received notification that there were some minor leaks along the pipeline that were being fixed. Workers in the area had experienced sudden headaches and lightheadedness and the company immediately moved to investigate the leak and address faulty seams that had eroded and weakened. The flow of naphtha was temporarily stopped for 72 hours so two portions of the pipeline could be removed, and the eroded portions replaced. Patel put enormous pressure on the repair team to get the repair…arrow_forwardin the MABE: learning to be multinational case report, what is the reccomended course of action?arrow_forward
- In the MABE case report what would be the reccomened course of action?arrow_forwardQuestion 6. An electrical engineering company is designing two types of solar panel systems: Standard Panels (S) and High-Efficiency Panels (H). The company has certain constraints regarding the hours of labor and material available for production each week. Each Standard Panel requires 4 hours of labor and 2 units of material and each High-Efficiency Panel requires 3 hours of labor and 5 units of material. The company has a maximum of 60 hours of labor and 40 units of material available per week. The profit from each Standard Panel is GH¢80, and the profit from each High-Efficiency Panel is GH¢100. The company wants to determine how many of each type of panel to produce in order to maximize profit. i) Solve this LPP by using graphical analysis ii) What will be the slack at the optimal solution point? Show calculation.arrow_forwardqusestion 6. An electrical engineering company is designing two types of solar panel systems: Standard Panels (S) and High-Efficiency Panels (H). The company has certain constraints regarding the hours of labor and material available for production each week. Each Standard Panel requires 4 hours of labor and 2 units of material and each High-Efficiency Panel requires 3 hours of labor and 5 units of material. The company has a maximum of 60 hours of labor and 40 units of material available per week. The profit from each Standard Panel is GH¢80, and the profit from each High-Efficiency Panel is GH¢100. The company wants to determine how many of each type of panel to produce in order to maximize profit. i. Formulate a linear programming model of the problem for the company. ii Convert the linear programming model formulated in (a) to a standard form.arrow_forward
 Practical Management ScienceOperations ManagementISBN:9781337406659Author:WINSTON, Wayne L.Publisher:Cengage,