
Videos
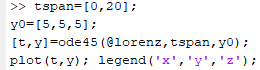
Perform the same computation for the Lorenz equations in Sec. 28.2, but use (a) Euler's method, (b) Heun's method (without iterating the corrector), (c) the fourth-order RK method, and (d) the MATLAB ode45 function. In all cases use single-precision variables and a step size of 0.1 and simulate from
(a)
To calculate: The solution of Lorentz equation
Answer to Problem 18P
Solution:
The solution of Lorentz equations by the Euler’s method with step size 0.1 gives unstable solution.
Explanation of Solution
Given Information:
Lorentz equations,
and Initial conditions are
Formula used:
Euler’s method for
Where, h is the step size.
Calculation:
Consider the equations,
The iteration formula for Euler’s method with step size
Use excel to find all the iteration with step size
Step 1: Name the column A as t and go to column A2 and put 0 then go to column A3 and write the formula as,
=A2+0.1
Then, Press enter and drag the column up to
Step 2: Now name the column B as x-Euler and go to column B2 and write 5 and then go to the column B3 and write the formula as,
=B2+0.1*(-10*B2+10*C2)
Step 3: Press enter and drag the column up to
Step 4: Now name the column C as y-Euler and go to column C2 and write 5 and then go to the column C3 and write the formula as,
=C2+0.1*(28*B2-C2-B2*D2)
Step 5: Press enter and drag the column up to
Step 6: Now name the column D as z-Euler and go to column D2 and write 5 and then go to the column D3 and write the formula as,
=D2+0.1*(-2.666667*D2+B2*C2)
Step 7: Press enter and drag the column up to
Thus, first few iterations are as shown below,
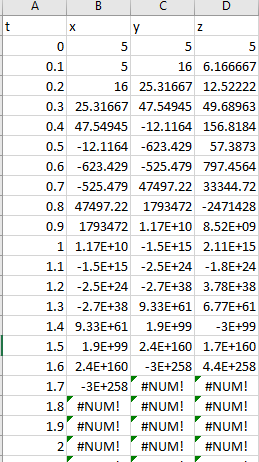
From the above result, it is observed that the solution of Lorentz equations by the Euler’s method with step size 0.1 the values are continuously decreasing. Hence, Euler method with step size 0.1 gives unstable solution for the Lorentz equations.
(b)
To calculate: The solution of Lorentz equation
Answer to Problem 18P
Solution:
The solution of Lorentz equations by the Heun’s method with step size 0.1 gives unstable solution.
Explanation of Solution
Given Information:
Lorentz equations,
and Initial conditions are
Formula used:
The iteration formula for Heun’s method is,
Calculation:
Consider the equations,
The following VBA code is used to solve the Lorentz equation by Heun’s method:
Code:
Output:
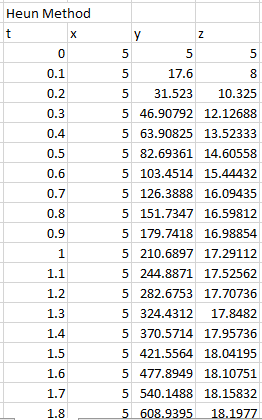
To draw the graph of the above results, follow the steps in excel sheet as given below,
Step 1: Select the cell from A4 to A205 and cell B4 to B205. Then, go to the Insert and select the scatter with smooth lines from the chart.
Step 2: Select the cell from A4 to A205 and cell C4 to C205. Then, go to the Insert and select the scatter with smooth lines from the chart.
Step 2: Select the cell from A4 to A205 and cell D4 to D205. Then, go to the Insert and select the scatter with smooth lines from the chart.
Step 4: Select one of the graphs and paste it on another graph to merge the graphs.
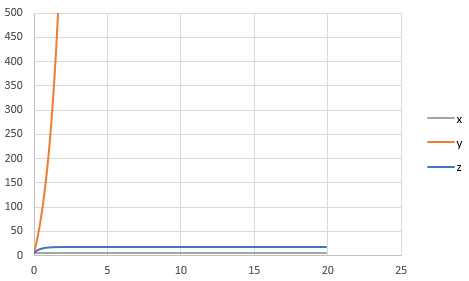
The graph obtained is,
And, to draw the phase plane plot follow the steps as below,
Step 4: Select the column B, column C and column D. Then, go to the Insert and select the scatter with smooth lines from the chart.
The graph obtained is,
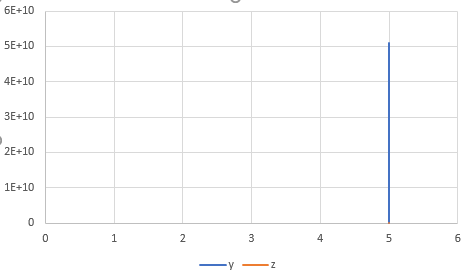
The phase plane plot is a straight line because solution of x is a constant value. The solution o0f Lorentz equation by Heun’s method with step size 0.1 is thus unstable.
(c)
To calculate: The solution of Lorentz equation
Answer to Problem 18P
Solution:
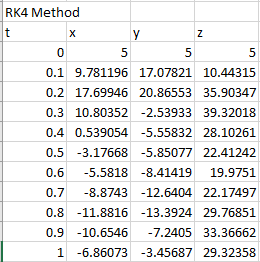
The first few solutions of Lorentz equation are,
| t | x | y | z |
| 0 | 5 | 5 | 5 |
| 0.1 | 9.781196 | 17.07821 | 10.44315 |
| 0.2 | 17.69946 | 20.86553 | 35.90347 |
| 0.3 | 10.80352 | -2.53933 | 39.32018 |
| 0.4 | 0.539054 | -5.55832 | 28.10261 |
| 0.5 | -3.17668 | -5.85077 | 22.41242 |
| 0.6 | -5.5818 | -8.41419 | 19.9751 |
| 0.7 | -8.8743 | -12.6404 | 22.17497 |
| 0.8 | -11.8816 | -13.3924 | 29.76851 |
| 0.9 | -10.6546 | -7.2405 | 33.36662 |
| 1 | -6.86073 | -3.45687 | 29.32358 |
Explanation of Solution
Given Information:
Lorentz equations,
and Initial conditions are
Formula used:
The fourth-order RK method for
Where,
Calculation:
The following VBA code is used to find the solution of Lorentz equation by the fourth order RK method:
Code:
Output:
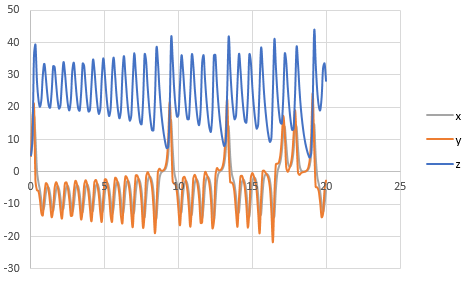
To draw the graph of the above results, follow the steps in excel sheet as given below,
Step 1: Select the cell from A4 to A205 and cell B4 to B205. Then, go to the Insert and select the scatter with smooth lines from the chart.
Step 2: Select the cell from A4 to A205 and cell C4 to C205. Then, go to the Insert and select the scatter with smooth lines from the chart.
Step 3: Select the cell from A4 to A205 and cell D4 to D205. Then, go to the Insert and select the scatter with smooth lines from the chart.
Step 4: Select one of the graphs and paste it on another graph to merge the graphs.
The graph obtained is,
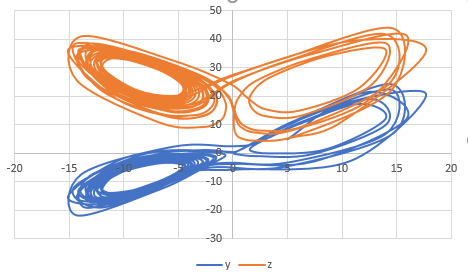
And, to draw the phase plane plot follow the steps as below,
Step 4: Select the column B, column C and column D. Then, go to the Insert and select the scatter with smooth lines from the chart.
The graph obtained is,
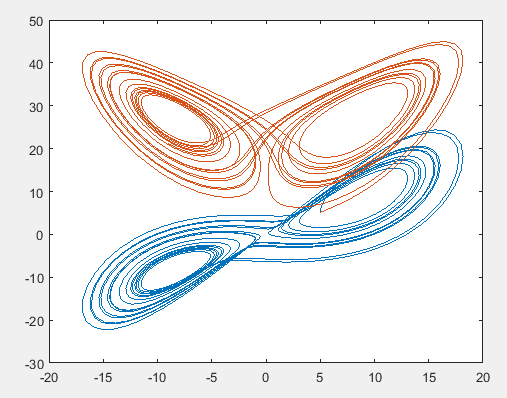
(d)
The solution of Lorentz equation
Answer to Problem 18P
Solution:
The solution graph of Lorentz equation is,
Explanation of Solution
Given Information:
Lorentz equations,
and Initial conditions are
Consider the Lorentz equations,
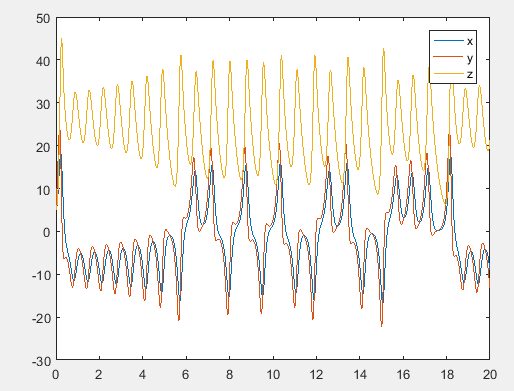
Use MATLAB ode45 function to solve the above differential functions as below,
Code:
Output:
The graph obtained as,
Write the command as below to plot the phase-plane,

The phase plane graph obtained as,
Want to see more full solutions like this?
Chapter 28 Solutions
EBK NUMERICAL METHODS FOR ENGINEERS
Additional Engineering Textbook Solutions
Mathematics for the Trades: A Guided Approach (11th Edition) (What's New in Trade Math)
Pathways To Math Literacy (looseleaf)
College Algebra (7th Edition)
Math in Our World
Precalculus: A Unit Circle Approach (3rd Edition)
Elementary & Intermediate Algebra


- [Q2]: The cost information supplied by the cost accountant is as follows:Sales 20,00 units, $ 10 per unitCalculate the (a/ newsale guantity and (b) new selling price to earn the sameVariable cost $ 6 per unit, Fixed Cost $ 30,000, Profit $ 50,000profit ifi) Variable cost increases by $ 2 per unitil) Fixed cost increase by $ 10,000Ili) Variable cost increase by $ 1 per unit and fixed cost reduces by $ 10,000arrow_forwardcan you please help me perform Visual Inspection and Fractography of the attatched image: Preliminary examination to identify the fracture origin, suspected fatigue striation, and corrosion evidences.arrow_forwardcan you please help[ me conduct Causal Analysis (FTA) on the scenario attatched: FTA diagram which is a fault tree analysis diagram will be used to gain an overview of the entire path of failure from root cause to the top event (i.e., the swing’s detachment) and to identify interactions between misuse, material decay and inspection errors.arrow_forward
- hi can you please help me in finding the stress intensity factor using a k-calcluator for the scenario attathced in the images.arrow_forwardHi, can you please help me .Identify and justify suitable analytical techniques of the scenario below, bearing in mind the kinds of information being handled to reach a conclusion (methodology). A child swing set was discovered to have failed at the fixing at the top of the chains connecting the seat to the top of the swing set. A 12 mm threaded steel bolt, connecting the shackle to the top beam, failed at the start of the threaded region on the linkage closest to the outside side of the swing set . The linkage and bolts were made of electro galvanised mild steel . The rigid bar chain alternatives and fixings were of the same material and appeared to be fitted in accordance with guidelines. The yield strength of the steel used is 260 MPa and the UTS is 380 MPa. The bolt that failed was threaded using a standard thread with a pitch (distance between threads) of 1.75 mm and a depth of approximately 1.1 mm. The swing set in question had been assigned to ‘toddlers’ with the application of…arrow_forwardHi, can you please define and calculate the failure mode of the linkage that failed on the swing (images added) : A child swing set was discovered to have failed at the fixing at the top of the chains connecting the seat to the top of the swing set. A 12 mm threaded steel bolt, connecting the shackle to the top beam, failed at the start of the threaded region on the linkage closest to the outside side of the swing set . The linkage and bolts were made of electro galvanised mild steel . The rigid bar chain alternatives and fixings were of the same material and appeared to be fitted in accordance with guidelines. The yield strength of the steel used is 260 MPa and the UTS is 380 MPa. The bolt that failed was threaded using a standard thread with a pitch (distance between threads) of 1.75 mm and a depth of approximately 1.1 mm. The swing set in question had been assigned to ‘toddlers’ with the application of a caged-type seat. However, the location was within the play area not…arrow_forward
- Page 11-68. The rectangular plate shown is subjected to a uniaxial stress of 2000 psi. Compute the shear stress and the tensile developed on a plane forming an angle of 30° with the longitud axis of the member. (Hint: Assume a cross-sectional area of unity) 2000 psi 2000 psi hparrow_forward11-70. A shear stress (pure shear) of 5000 psi exists on an element. (a) Determine the maximum tensile and compressive stresses caused in the element due to this shear. (b) Sketch the element showing the planes on which the maximum tensile and compressive stresses act.arrow_forward11-20. An aluminum specimen of circular cross section, 0.50 in. in diameter, ruptured under a tensile load of 12,000 lb. The plane of failure was found to be at 48° with a plane perpendicular to the longitudinal axis of the specimen. (a) Compute the shear stress on the failure plane. (b) Compute the maximum tensile stress. (c) Compute the tensile stress on the failure plane. hparrow_forward
- A long flat steel bar 13 mm thick and 120 mm wide has semicircular grooves as shown and carries a tensile load of 50 kN Determine the maximum stress if plate r= 8mm r=21mm r=38mmarrow_forwardProblem 13: F₁ = A =250 N 30% Determine the moment of each of the three forces about point B. F₂ = 300 N 60° 2 m -3 m B 4 m F3=500 Narrow_forward3 kN 3 kN 1.8 kN/m 80 mm B 300 mm D an 1.5 m-1.5 m--1.5 m- PROBLEM 5.47 Using the method of Sec. 5.2, solve Prob. 5.16 PROBLEM 5.16 For the beam and loading shown, determine the maximum normal stress due to bending on a transverse section at C.arrow_forward
 Elements Of ElectromagneticsMechanical EngineeringISBN:9780190698614Author:Sadiku, Matthew N. O.Publisher:Oxford University Press
 Mechanics of Materials (10th Edition)Mechanical EngineeringISBN:9780134319650Author:Russell C. HibbelerPublisher:PEARSON
 Thermodynamics: An Engineering ApproachMechanical EngineeringISBN:9781259822674Author:Yunus A. Cengel Dr., Michael A. BolesPublisher:McGraw-Hill Education
 Control Systems EngineeringMechanical EngineeringISBN:9781118170519Author:Norman S. NisePublisher:WILEY
 Mechanics of Materials (MindTap Course List)Mechanical EngineeringISBN:9781337093347Author:Barry J. Goodno, James M. GerePublisher:Cengage Learning
 Engineering Mechanics: StaticsMechanical EngineeringISBN:9781118807330Author:James L. Meriam, L. G. Kraige, J. N. BoltonPublisher:WILEY