Concept explainers
Videos
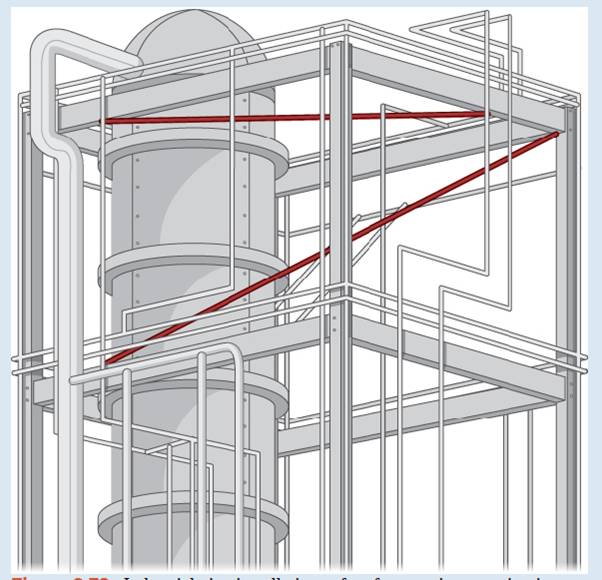
Figure 2.73 Industrial pipe installations often feature pipes running in different directions. How can we find the distance between two skew pipes?
Finding the distance from a point to a line or from a line to a plane seems like a pretty abstract procedure. But, if the lines represent pipes in a chemical plant or tubes in an oil refinery or roads at an intersection of highways, confirming that the distance between them meets specifications can be both important and awkward to measure. One way is to model the two pipes as lines, using the techniques in this Chapter, and then calculate the distance between them. The calculation involves forming
product.
The symmetric forms of two lines,
You are to develop a formula for the distance
minimum distance, so this is the length of a line segment or the length of a vector that is perpendicular to both lines and intersects both lines.
5. The dot product of two vectors is the magnitude of the projection of one vector onto the other—that is,
Want to see the full answer?
Check out a sample textbook solution
Chapter 2 Solutions
Calculus Volume 3
Additional Math Textbook Solutions
A First Course in Probability (10th Edition)
A Problem Solving Approach To Mathematics For Elementary School Teachers (13th Edition)
Elementary Statistics: Picturing the World (7th Edition)
Calculus: Early Transcendentals (2nd Edition)
Using and Understanding Mathematics: A Quantitative Reasoning Approach (6th Edition)
Thinking Mathematically (6th Edition)


- 1. A bicyclist is riding their bike along the Chicago Lakefront Trail. The velocity (in feet per second) of the bicyclist is recorded below. Use (a) Simpson's Rule, and (b) the Trapezoidal Rule to estimate the total distance the bicyclist traveled during the 8-second period. t 0 2 4 6 8 V 10 15 12 10 16 2. Find the midpoint rule approximation for (a) n = 4 +5 x²dx using n subintervals. 1° 2 (b) n = 8 36 32 28 36 32 28 24 24 20 20 16 16 12 8- 4 1 2 3 4 5 6 12 8 4 1 2 3 4 5 6arrow_forward1. A Blue Whale's resting heart rate has period that happens to be approximately equal to 2π. A typical ECG of a whale's heartbeat over one period may be approximated by the function, f(x) = 0.005x4 2 0.005x³-0.364x² + 1.27x on the interval [0, 27]. Find an nth-order Fourier approximation to the Blue Whale's heartbeat, where n ≥ 3 is different from that used in any other posts on this topic, to generate a periodic function that can be used to model its heartbeat, and graph your result. Be sure to include your chosen value of n in your Subject Heading.arrow_forwardI need help explaining on this example on how can I define the Time-Domain Function, Apply the Laplace Transformation Formula, andarrow_forward
- ma Classes Term. Spring 2025 Title Details Credit Hours CRN Schedule Type Grade Mode Level Date Status Message *MATHEMATICS FOR MANAGEME... MTH 245, 400 4 54835 Online Normal Grading Mode Ecampus Undergradu... 03/21/2025 Registered **Web Registered... *SOIL SCIENCE CSS 205, 400 0 52298 Online Normal Grading Mode Undergraduate 03/21/2025 Waitlisted Waitlist03/21/2025 PLANT PATHOLOGY BOT 451, 400 4 56960 Online Normal Grading Mode Undergraduate 03/21/2025 Registered **Web Registered... Records: 3 Schedule Schedule Detailsarrow_forwardHere is an augmented matrix for a system of equations (three equations and three variables). Let the variables used be x, y, and z: 1 2 4 6 0 1 -1 3 0 0 1 4 Note: that this matrix is already in row echelon form. Your goal is to use this row echelon form to revert back to the equations that this represents, and then to ultimately solve the system of equations by finding x, y and z. Input your answer as a coordinate point: (x,y,z) with no spaces.arrow_forward1 3 -4 In the following matrix perform the operation 2R1 + R2 → R2. -2 -1 6 After you have completed this, what numeric value is in the a22 position?arrow_forward
- 5 -2 0 1 6 12 Let A = 6 7 -1 and B = 1/2 3 -14 -2 0 4 4 4 0 Compute -3A+2B and call the resulting matrix R. If rij represent the individual entries in the matrix R, what numeric value is in 131? Input your answer as a numeric value only.arrow_forward1 -2 4 10 My goal is to put the matrix 5 -1 1 0 into row echelon form using Gaussian elimination. 3 -2 6 9 My next step is to manipulate this matrix using elementary row operations to get a 0 in the a21 position. Which of the following operations would be the appropriate elementary row operation to use to get a 0 in the a21 position? O (1/5)*R2 --> R2 ○ 2R1 + R2 --> R2 ○ 5R1+ R2 --> R2 O-5R1 + R2 --> R2arrow_forwardThe 2x2 linear system of equations -2x+4y = 8 and 4x-3y = 9 was put into the following -2 4 8 augmented matrix: 4 -3 9 This augmented matrix is then converted to row echelon form. Which of the following matrices is the appropriate row echelon form for the given augmented matrix? 0 Option 1: 1 11 -2 Option 2: 4 -3 9 Option 3: 10 ܂ -2 -4 5 25 1 -2 -4 Option 4: 0 1 5 1 -2 Option 5: 0 0 20 -4 5 ○ Option 1 is the appropriate row echelon form. ○ Option 2 is the appropriate row echelon form. ○ Option 3 is the appropriate row echelon form. ○ Option 4 is the appropriate row echelon form. ○ Option 5 is the appropriate row echelon form.arrow_forward
- Let matrix A have order (dimension) 2x4 and let matrix B have order (dimension) 4x4. What results when you compute A+B? The resulting matrix will have dimensions of 2x4. ○ The resulting matrix will be a single number (scalar). The resulting matrix will have dimensions of 4x4. A+B is undefined since matrix A and B do not have the same dimensions.arrow_forwardIf -1 "[a446]-[254] 4b = -1 , find the values of a and b. ○ There is no solution for a and b. ○ There are infinite solutions for a and b. O a=3, b=3 O a=1, b=2 O a=2, b=1 O a=2, b=2arrow_forwardA student puts a 3x3 system of linear equations is into an augmented matrix. The student then correctly puts the augmented matrix into row echelon form (REF), which yields the following resultant matrix: -2 3 -0.5 10 0 0 0 -2 0 1 -4 Which of the following conclusions is mathematically supported by the work shown about system of linear equations? The 3x3 system of linear equations has no solution. ○ The 3x3 system of linear equations has infinite solutions. The 3x3 system of linear equations has one unique solution.arrow_forward
 Holt Mcdougal Larson Pre-algebra: Student Edition...AlgebraISBN:9780547587776Author:HOLT MCDOUGALPublisher:HOLT MCDOUGAL
 Glencoe Algebra 1, Student Edition, 9780079039897...AlgebraISBN:9780079039897Author:CarterPublisher:McGraw Hill
 Elementary AlgebraAlgebraISBN:9780998625713Author:Lynn Marecek, MaryAnne Anthony-SmithPublisher:OpenStax - Rice University
 Algebra: Structure And Method, Book 1AlgebraISBN:9780395977224Author:Richard G. Brown, Mary P. Dolciani, Robert H. Sorgenfrey, William L. ColePublisher:McDougal Littell
 College AlgebraAlgebraISBN:9781305115545Author:James Stewart, Lothar Redlin, Saleem WatsonPublisher:Cengage Learning